Price Elasticity of Supply (PES)
Microeconomics
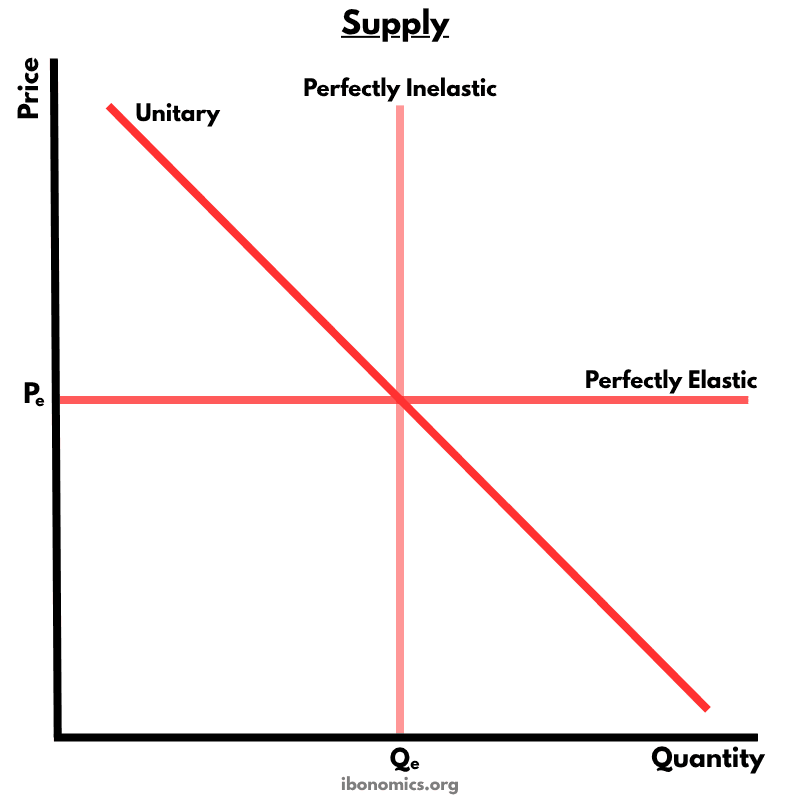
A diagram illustrating different types of price elasticity of supply: perfectly inelastic, perfectly elastic, and unitary elastic supply curves.
Curves and Elements
perfectly inelastic
Perfectly Inelastic Supply: Vertical line — quantity supplied remains constant regardless of price (PES = 0).
perfectly elastic
Perfectly Elastic Supply: Horizontal line — any quantity supplied at one fixed price (PES = ∞).
unitary
Unitary Elastic Supply: Upward-sloping supply curve with PES = 1 — proportional response in supply to price changes.
The diagram shows three types of supply elasticity, which measure how quantity supplied responds to changes in price.
A perfectly inelastic supply curve is vertical, indicating that quantity supplied does not change regardless of the price (PES = 0).
A perfectly elastic supply curve is horizontal, indicating that firms will supply any quantity at one fixed price, but nothing at any other price (PES = ∞).
A unitary elastic supply curve has a constant elasticity of 1, meaning the percentage change in quantity supplied is equal to the percentage change in price.
Elasticity of supply is influenced by factors such as time, availability of inputs, spare production capacity, and the flexibility of the production process.
More Microeconomics Diagrams
Explore other diagrams from the same unit to deepen your understanding

The fundamental diagram showing the relationship between demand and supply in a competitive market, determining equilibrium price and quantity.

A basic diagram showing the inverse relationship between price and quantity demanded, illustrating the law of demand.

A basic diagram showing the positive relationship between price and quantity supplied, illustrating the law of supply.

A simple diagram showing four common forms of government intervention in markets: subsidies, taxes, price controls, and direct provision.

A diagram showing how price elasticity of demand changes along a straight-line demand curve, from elastic to unitary elastic to inelastic.

A diagram showing how price elasticity of demand affects total revenue, with total revenue maximized where demand is unitary elastic.