Indirect Tax and Inelastic Demand
Microeconomics
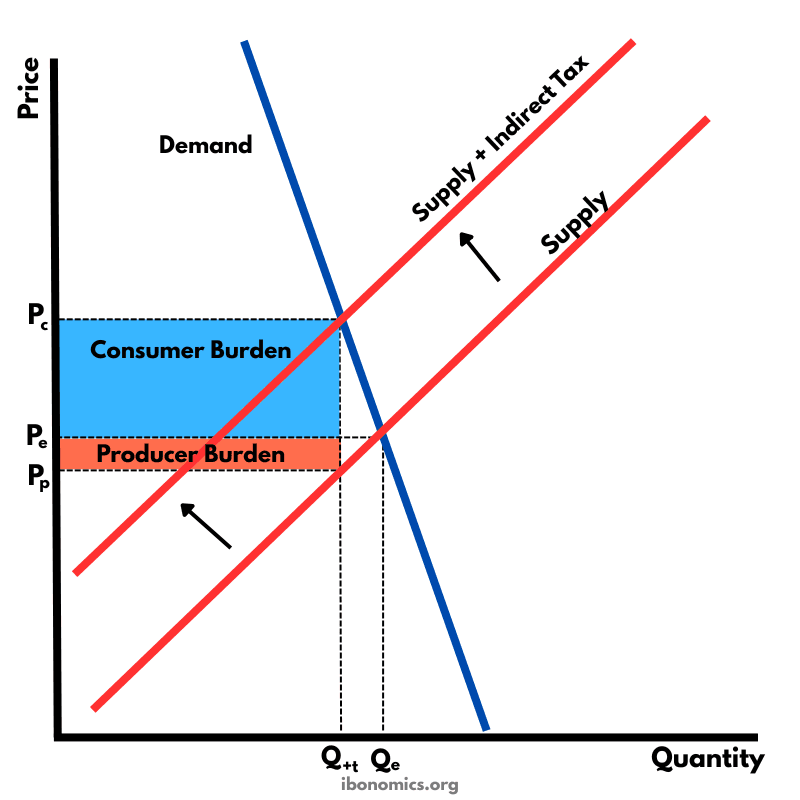
A supply and demand diagram showing the effect of an indirect tax on a good with inelastic demand. The consumer bears a larger share of the tax burden.
Curves and Elements
demand
Demand Curve (D): Steep, indicating inelastic demand. Shows that quantity demanded changes little with price.
supply
Original Supply Curve (S): Upward sloping as per the law of supply. After tax, it shifts to the left.
supply with tax
Supply + Indirect Tax: The new supply curve after the tax is imposed, indicating higher costs.
equilibrium
Old Equilibrium (Pe, Qe): Before tax. New equilibrium is at Pc and Qₜ after tax.
An indirect tax shifts the supply curve upward/leftward, from 'Supply' to 'Supply + Indirect Tax'.
The vertical distance between the two supply curves represents the per-unit tax imposed.
The price consumers pay rises from Pe to Pc, while the price producers effectively receive falls from Pe to Pp.
The consumer burden is represented by the area between Pc and Pe over the quantity sold (Qₜ).
The producer burden is represented by the area between Pe and Pp over Qₜ.
When demand is inelastic, consumers are less responsive to price changes, so they bear a larger share of the tax burden.
The steeper the demand curve, the larger the area of consumer burden compared to producer burden.
More Microeconomics Diagrams
Explore other diagrams from the same unit to deepen your understanding
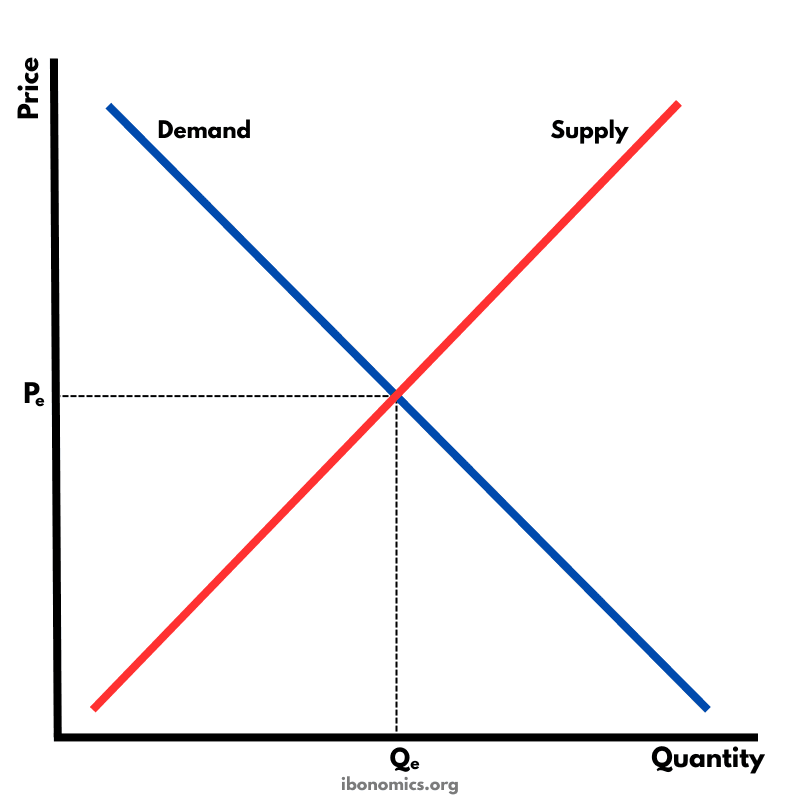
The fundamental diagram showing the relationship between demand and supply in a competitive market, determining equilibrium price and quantity.
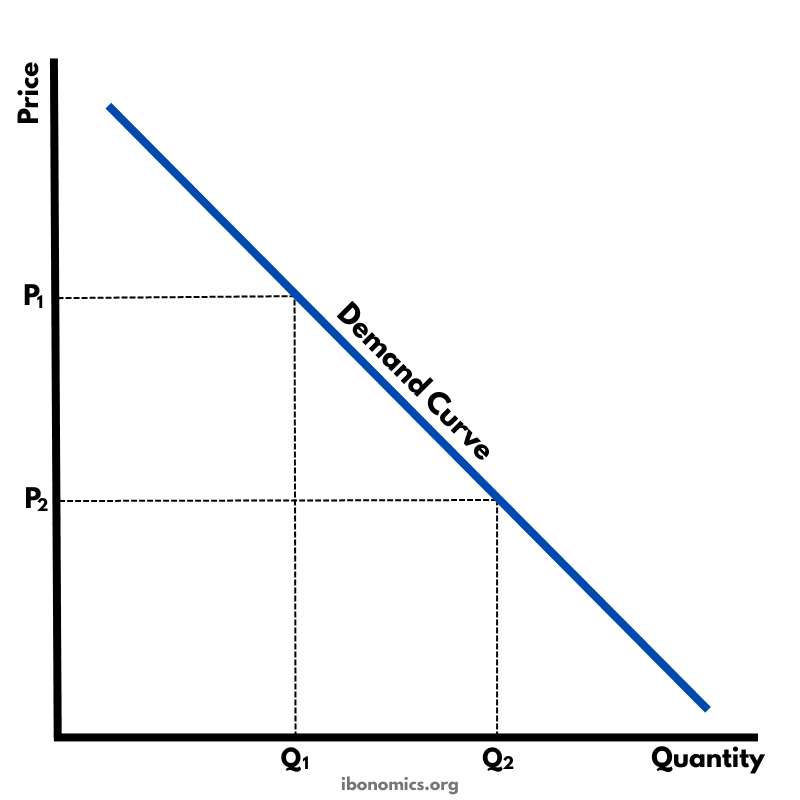
A basic diagram showing the inverse relationship between price and quantity demanded, illustrating the law of demand.
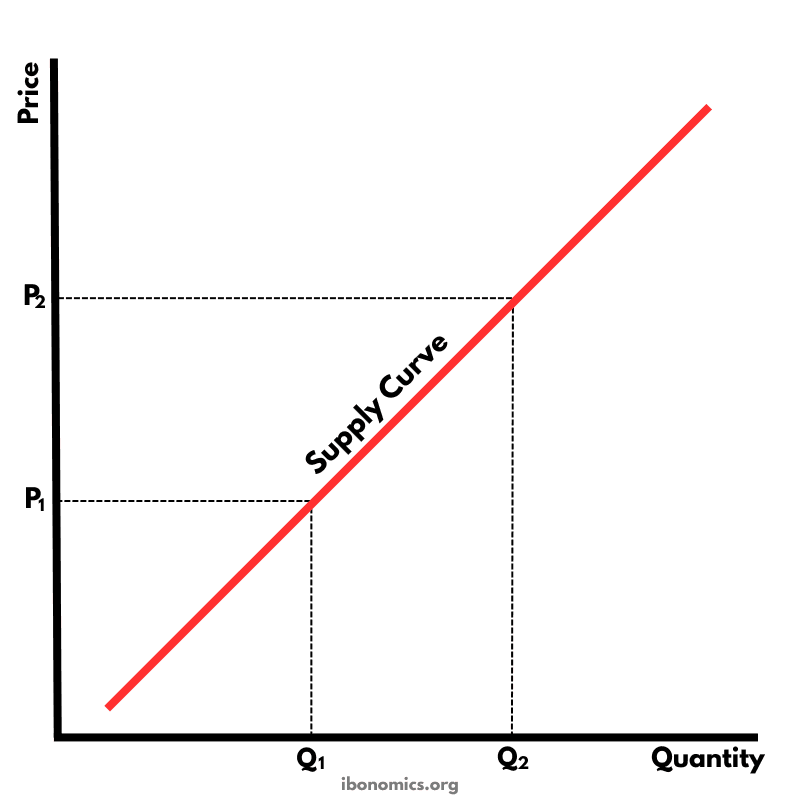
A basic diagram showing the positive relationship between price and quantity supplied, illustrating the law of supply.
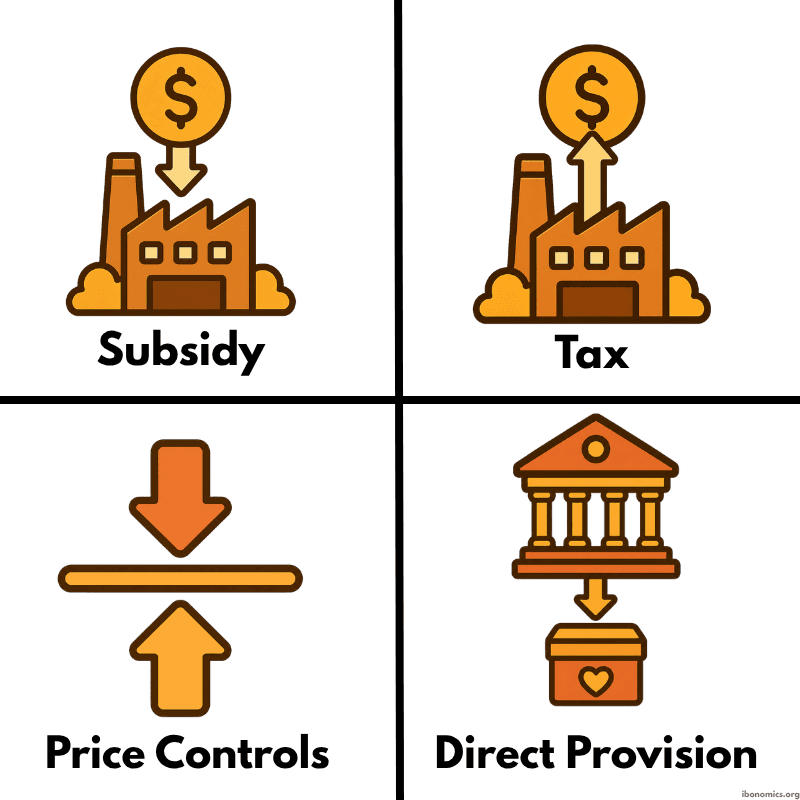
A simple diagram showing four common forms of government intervention in markets: subsidies, taxes, price controls, and direct provision.
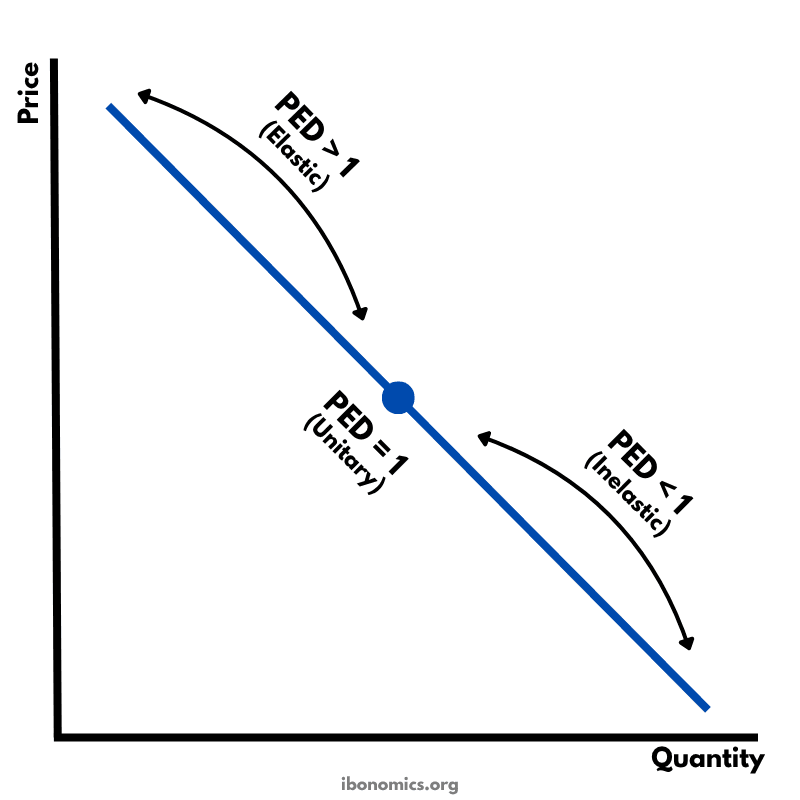
A diagram showing how price elasticity of demand changes along a straight-line demand curve, from elastic to unitary elastic to inelastic.
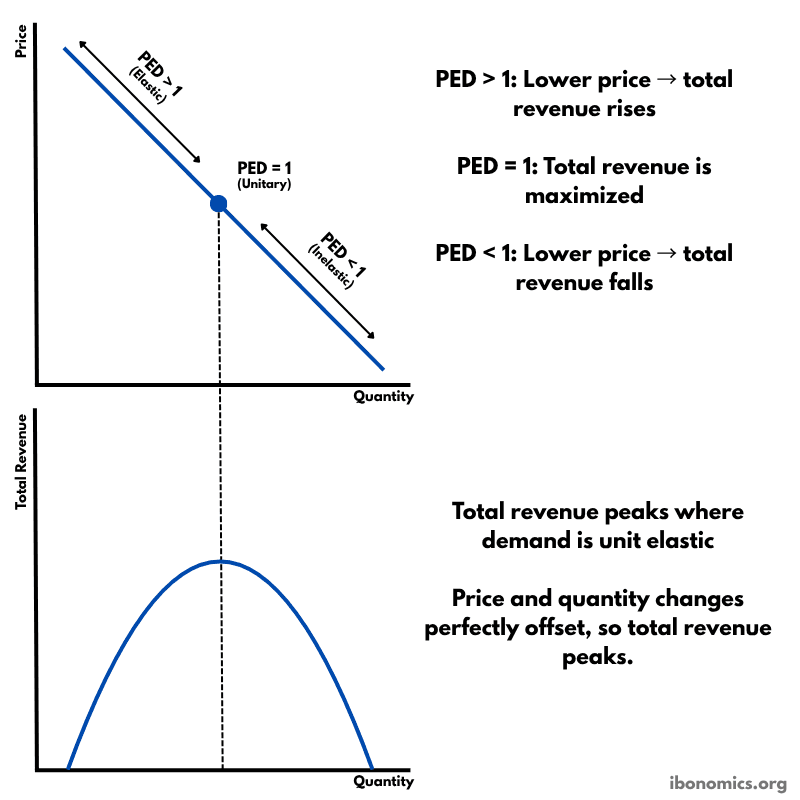
A diagram showing how price elasticity of demand affects total revenue, with total revenue maximized where demand is unitary elastic.