Circular Flow of Income: Injections and Withdrawals
Macroeconomics
A refined circular flow model highlighting the roles of injections and withdrawals in determining national income and economic equilibrium.
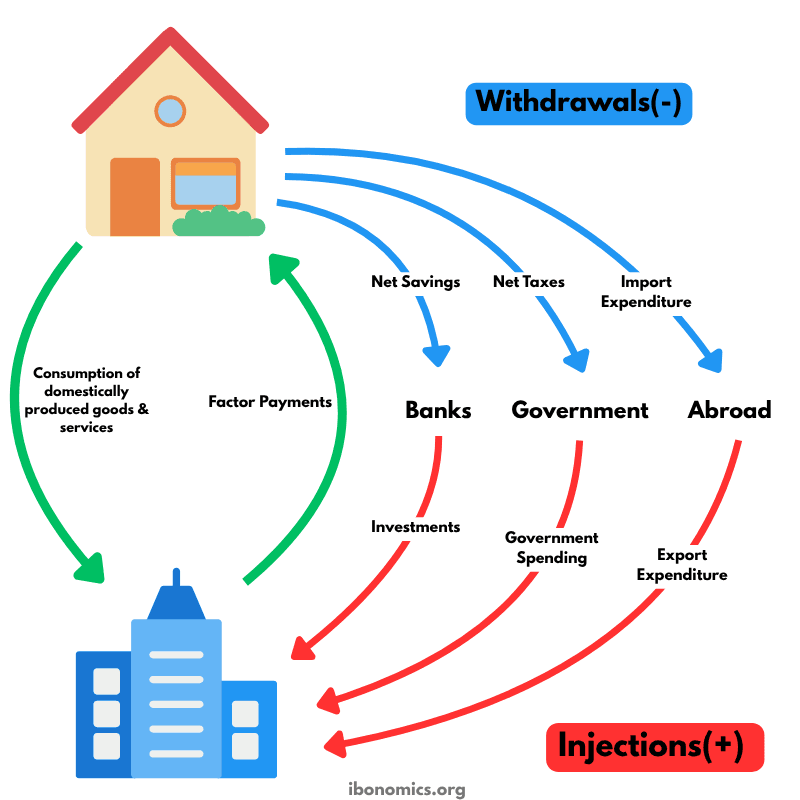
Curves and Elements
households
Households: Provide labor and other factors of production to firms, receive factor payments, and consume goods and services.
firms
Firms: Pay households for resources and produce goods and services for household consumption.
banks
Banks: Receive savings from households (withdrawal) and lend to firms as investment (injection).
government
Government: Collects taxes from households (withdrawal) and injects spending into the economy.
abroad
Foreign Sector (Abroad): Imports are withdrawals; exports are injections into the circular flow.
Households receive factor payments (wages, rent, interest, profit) from firms in exchange for providing factors of production.
They spend income on domestically produced goods and services, completing the inner flow of income.
Withdrawals (leakages) remove income from the economy: net savings (to banks), net taxes (to the government), and import expenditure (to abroad).
Injections add income into the economy: investments (from banks), government spending, and export expenditure (from abroad).
If total injections equal total withdrawals, the economy is in equilibrium.
If injections exceed withdrawals, national income rises; if withdrawals exceed injections, national income falls.
More Macroeconomics Diagrams
Explore other diagrams from the same unit to deepen your understanding

A diagram illustrating the fluctuations in real GDP over time, including periods of boom, recession, peak, and trough, relative to the long-term trend of economic growth.

This diagram shows the intersection of the aggregate demand (AD) and short-run aggregate supply (AS) curves to determine the equilibrium price level and real GDP.

A diagram showing the Classical model of aggregate demand (AD), short-run aggregate supply (SRAS), and long-run aggregate supply (LRAS), used to explain long-run macroeconomic equilibrium.

A Keynesian aggregate demand and long-run aggregate supply (AD–LRAS) diagram showing how real GDP and the price level interact across different phases of the economy, including spare capacity and full employment.

A diagram showing an output (deflationary) gap, where the economy is producing below its full employment level of output (Ye).
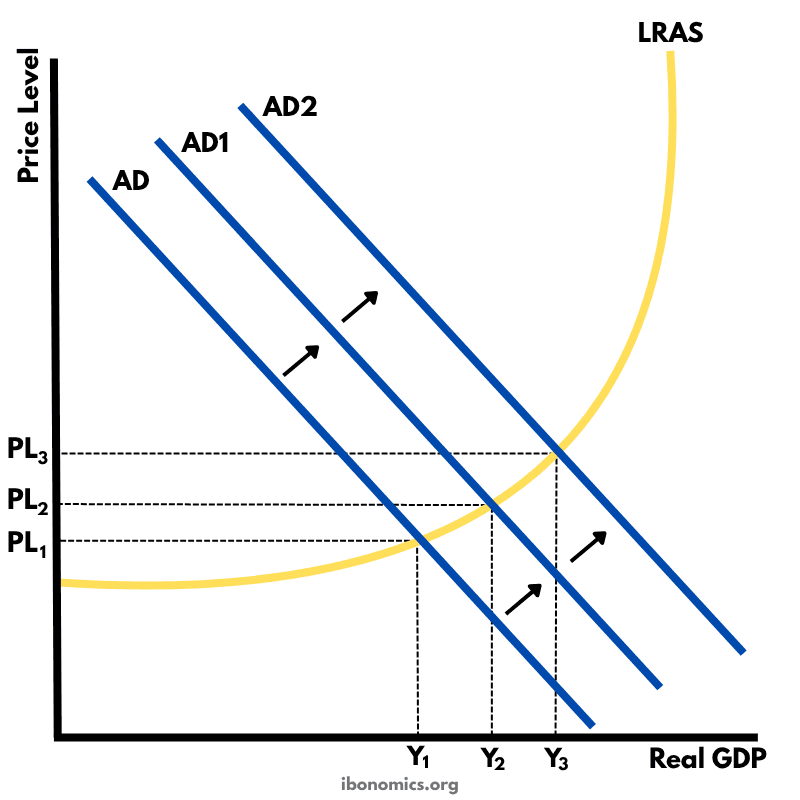
This diagram shows how an initial increase in aggregate demand leads to a multiplied increase in national output (real GDP) and price level within the Keynesian framework.