Minimum Wage – Labour Market Effects
Microeconomics
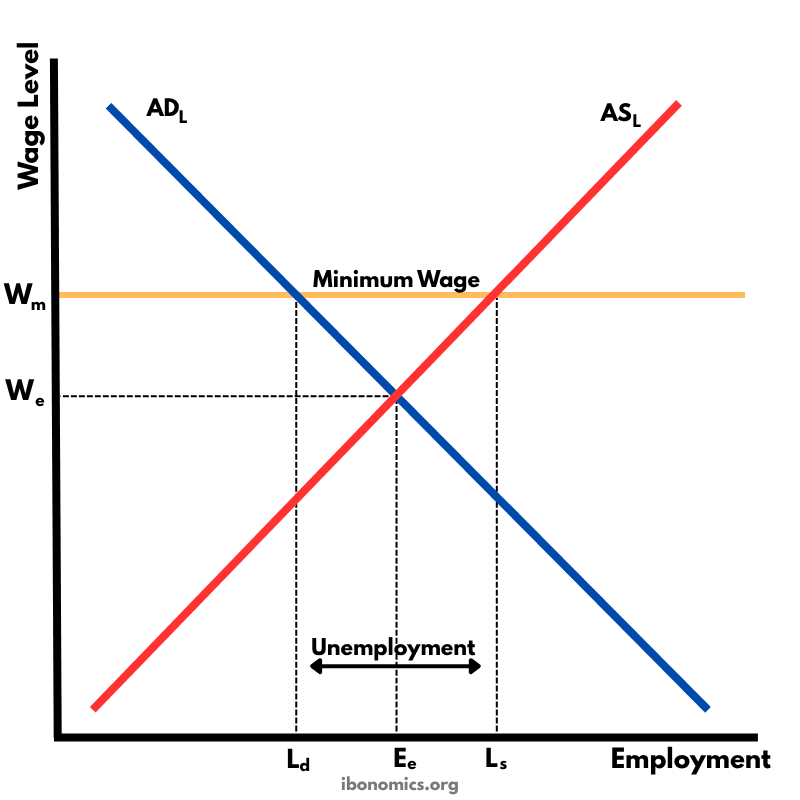
This diagram shows how a government-imposed minimum wage above the equilibrium wage causes excess supply of labour, resulting in unemployment.
Curves and Elements
adl
ADL: Aggregate demand for labour, downward sloping as higher wages discourage hiring.
asl
ASL: Aggregate supply of labour, upward sloping as more workers are willing to work for higher wages.
wm
Wm: Minimum wage set by the government, above the market equilibrium wage.
we
We: Equilibrium wage where ADL intersects ASL.
ld
Ld: Quantity of labour demanded at the minimum wage level.
ee
Ee: Employment level at market equilibrium (We).
ls
Ls: Quantity of labour supplied at the minimum wage level.
unemployment
Unemployment: The gap between Ls and Ld caused by the wage floor.
The equilibrium wage is at We, where the demand for labour (ADL) equals the supply of labour (ASL), and employment is at Ee.
A minimum wage Wm is introduced above We, setting a legal floor below which wages cannot fall.
At Wm, more workers are willing to work (Ls) due to the higher wage, but firms demand less labour (Ld), creating a surplus of labour.
This surplus represents unemployment, which is the horizontal distance between Ls and Ld.
Minimum wages aim to increase incomes for low-skilled workers but may lead to job losses or informal employment if set too high.
More Microeconomics Diagrams
Explore other diagrams from the same unit to deepen your understanding

The fundamental diagram showing the relationship between demand and supply in a competitive market, determining equilibrium price and quantity.

A basic diagram showing the inverse relationship between price and quantity demanded, illustrating the law of demand.

A basic diagram showing the positive relationship between price and quantity supplied, illustrating the law of supply.

A simple diagram showing four common forms of government intervention in markets: subsidies, taxes, price controls, and direct provision.

A diagram showing how price elasticity of demand changes along a straight-line demand curve, from elastic to unitary elastic to inelastic.

A diagram showing how price elasticity of demand affects total revenue, with total revenue maximized where demand is unitary elastic.