Macroeconomics in IB Economics: GDP, Inflation, Unemployment, Growth and Policy
A clear overview of IB Macroeconomics, covering GDP, inflation, unemployment, economic growth, inequality and demand-side and supply-side policies.

Macroeconomics in IB Economics: GDP, Inflation, Unemployment, Growth and Policy
Macroeconomics studies the economy as a whole. Instead of focusing on one market, one firm or one group of consumers, it looks at national output, the general price level, unemployment, economic growth, inequality and government policy.
For IB Economics students, macroeconomics is important because it connects theory to the economic issues people see in the news: rising prices, recessions, interest rate changes, government spending, unemployment, tax policy and living standards.
The main challenge is learning how the big variables fit together. GDP, inflation and unemployment are not separate topics. They are connected through aggregate demand, aggregate supply, the circular flow of income and policy choices made by governments and central banks.
What macroeconomics is really about
Macroeconomics examines the behaviour and performance of the whole economy. It asks questions such as: Is output rising? Are prices stable? Are people able to find work? Is economic growth sustainable? Are living standards improving? Is income distributed fairly?
A useful starting point is the circular flow of income model. In a simplified economy, households provide factors of production to firms, and firms pay households income. Households then spend income on goods and services produced by firms.
In the real economy, the circular flow is affected by leakages and injections. Leakages are withdrawals from the circular flow, such as savings, taxes and imports. Injections are additions to the circular flow, such as investment, government spending and exports.
If injections rise relative to leakages, aggregate demand may increase. If leakages rise relative to injections, aggregate demand may weaken. This is why leakages and injections are useful for understanding recessions, booms and policy responses.
GDP and measuring economic activity
Gross domestic product, or GDP, measures the total value of final goods and services produced within an economy over a given period of time. It is one of the most common indicators used to measure economic activity.
Nominal GDP is measured using current prices. Real GDP adjusts for inflation, making it better for comparing output over time. GDP per capita divides GDP by the population, giving a rough measure of average income or output per person.
IB students should be careful: GDP is not the same as economic well-being. GDP can rise even if inequality worsens, pollution increases or working hours become excessive. It also excludes some unpaid work and may not fully capture the informal economy.
Still, GDP is useful because it helps economists track whether an economy is expanding or contracting. Rising real GDP usually suggests higher output and possibly higher incomes. Falling real GDP may indicate a recession or slowdown.
This topic is explored further in measuring economic activity.
Inflation and the general price level
Inflation is a sustained increase in the general price level of an economy over time. It does not mean that every single price rises. It means that, on average, goods and services become more expensive.
Inflation reduces the purchasing power of money. If prices rise faster than incomes, households may be able to buy fewer goods and services. Inflation can also create uncertainty for firms because future costs and prices become harder to predict.
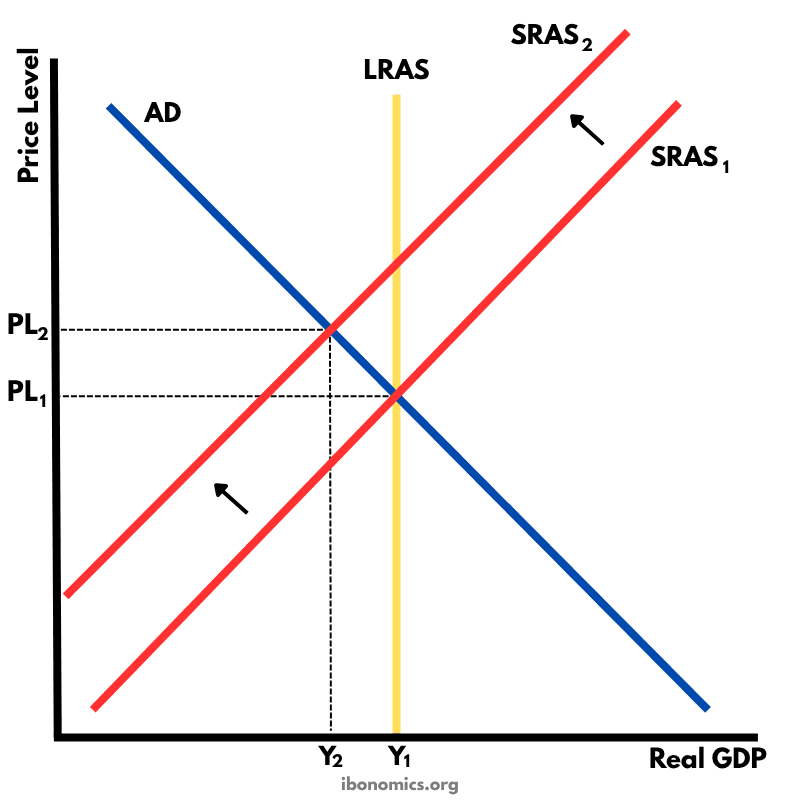
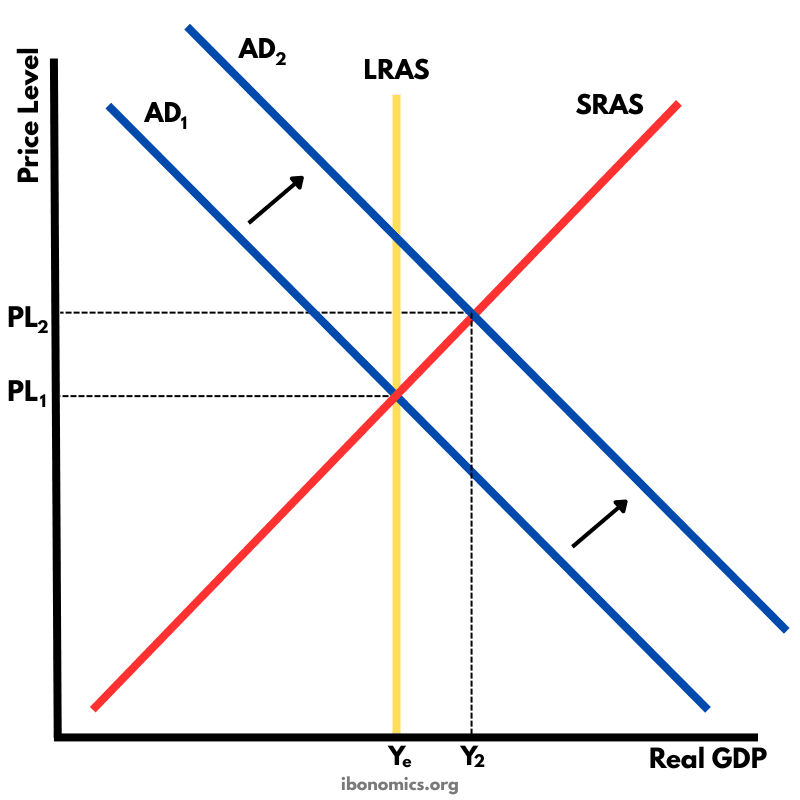
In IB Macroeconomics, inflation is often explained using aggregate demand and aggregate supply. Demand-pull inflation occurs when aggregate demand increases beyond the economy’s capacity to produce, putting upward pressure on the price level. Cost-push inflation occurs when production costs rise, shifting short-run aggregate supply left and increasing the price level while reducing real output.
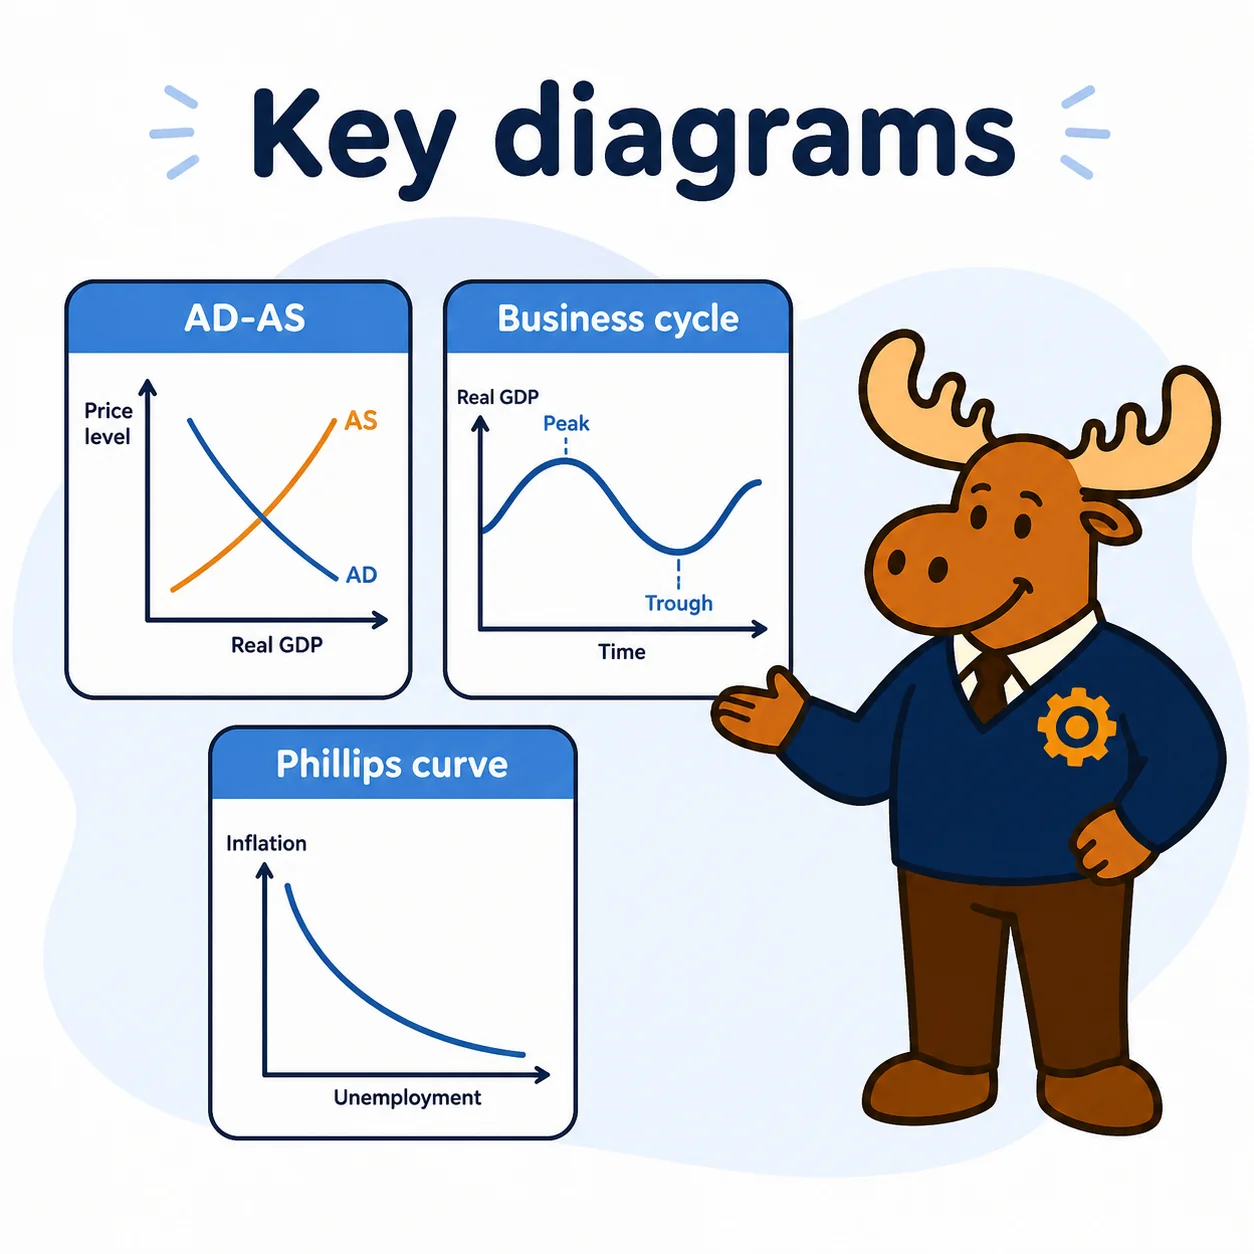
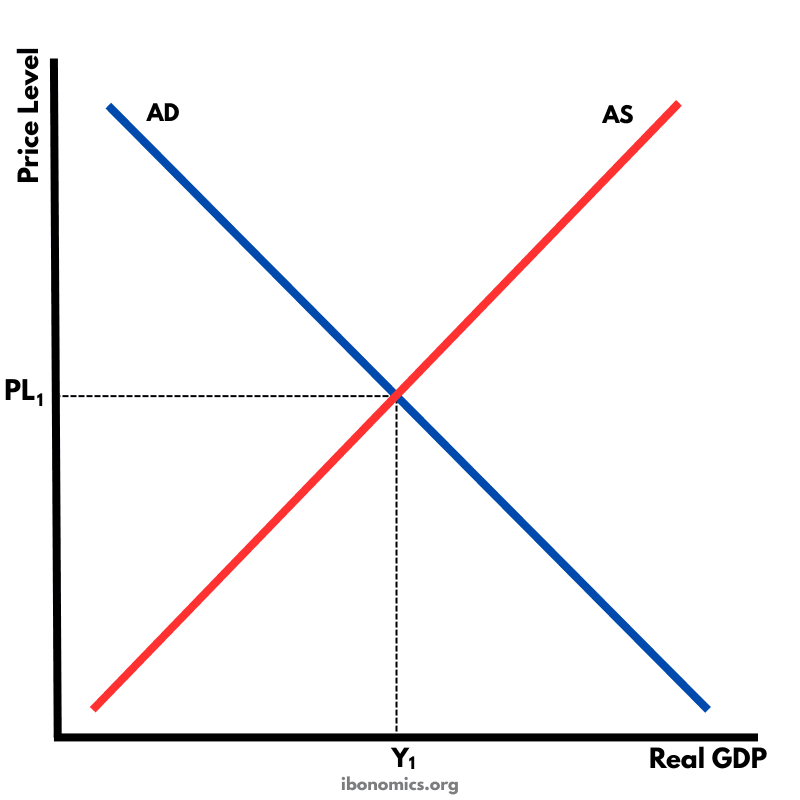
On an AD/AS diagram, the vertical axis shows the average price level, and the horizontal axis shows real output. If aggregate demand shifts right, real output and the price level usually rise in the short run. If short-run aggregate supply shifts left, real output falls while the price level rises.
The diagram does not prove exactly what will happen in every economy, but it helps explain the likely direction of change under specific assumptions.
Unemployment and spare capacity
Unemployment occurs when people who are willing and able to work cannot find a job. The unemployment rate measures unemployed workers as a percentage of the labour force.
Different types of unemployment have different causes. Cyclical unemployment is linked to weak aggregate demand. If households, firms or governments spend less, firms may reduce output and hire fewer workers. Structural unemployment occurs when workers’ skills do not match the jobs available, often because of technological change, globalisation or changes in consumer demand. Frictional unemployment occurs when workers are between jobs.
In an AD/AS framework, a fall in aggregate demand can reduce real output. If firms produce less, they need fewer workers, so unemployment may rise. This is why recessions often lead to higher unemployment.
However, not all unemployment can be solved simply by increasing demand. If unemployment is structural, expansionary demand-side policy may create inflationary pressure without solving the skills mismatch. In that case, supply-side policies such as training, education or labour market reforms may be more appropriate.
Economic growth: actual and potential
Economic growth means an increase in real output over time. IB students should distinguish between actual growth and potential growth.
Actual growth is an increase in real GDP. It is shown in an AD/AS diagram as a movement from one output level to a higher output level, often because aggregate demand increases or spare capacity is used more effectively.
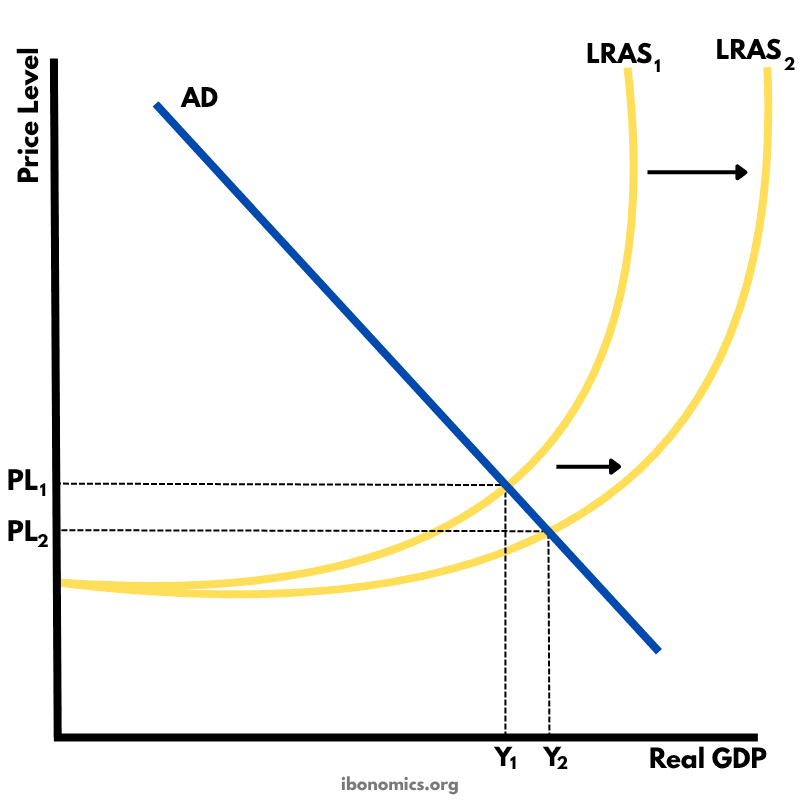
Potential growth is an increase in the economy’s productive capacity. It is shown by an outward shift of the long-run aggregate supply curve or the production possibilities curve. This may happen because of better technology, improved education, more capital, stronger infrastructure or a larger labour force.
This distinction matters. An economy can experience short-term growth by using existing resources more fully. But long-term growth requires improvements in productive capacity.
Economic growth can improve living standards by increasing incomes, employment opportunities and tax revenue. However, growth may also create environmental costs, inflationary pressure or unequal gains if the benefits are not widely shared.
Aggregate demand and aggregate supply
The central macroeconomic model in IB Economics is the aggregate demand and aggregate supply model. It helps explain changes in real output, unemployment, inflation and economic growth.
Aggregate demand is the total planned spending on domestic goods and services at different average price levels. It is usually written as AD = C + I + G + X - M, where C is consumption, I is investment, G is government spending, X is exports and M is imports.
Aggregate supply is the total amount of goods and services firms are willing and able to produce at different average price levels. Short-run aggregate supply can shift because of changes in production costs, wages, commodity prices, taxes, subsidies or supply shocks. Long-run aggregate supply is linked to the economy’s productive potential.
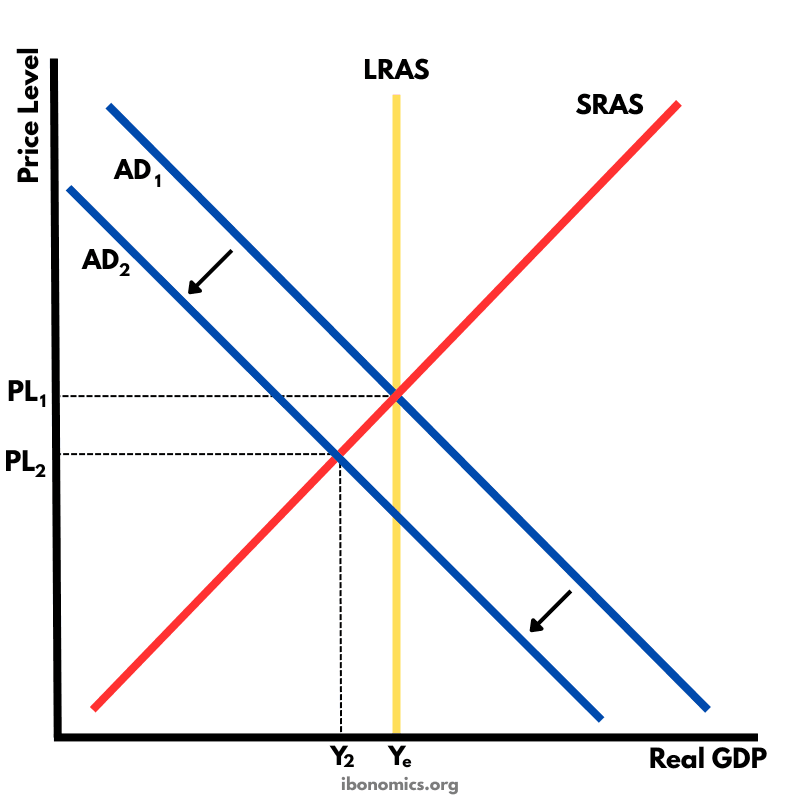
In an AD/AS diagram, the vertical axis shows the average price level, and the horizontal axis shows real output. If AD shifts right while SRAS stays fixed, real output and the price level rise in the short run. If AD shifts left, real output and the price level fall, and unemployment may increase.
If SRAS shifts left, the economy may experience stagflation: lower real output, higher unemployment and higher inflation. If LRAS shifts right, the economy’s productive capacity increases, allowing more output to be produced without the same inflationary pressure.
You can study this model in more depth in aggregate demand and supply.
Macroeconomic objectives
Governments usually pursue several macroeconomic objectives at the same time. These include economic growth, low unemployment, low and stable inflation, equity in income distribution, external balance and environmental sustainability.
These objectives can conflict. Expansionary fiscal policy may reduce unemployment by increasing aggregate demand, but it may also increase inflationary pressure or worsen the government budget balance. Higher interest rates may reduce inflation, but they may also reduce investment, consumption and economic growth.
This is why macroeconomic policy involves trade-offs. A policy that helps one objective may make another objective harder to achieve.
In IB essays, it is often useful to connect policy evaluation to these objectives. For example, a policy should not only be judged by whether it increases GDP. It should also be evaluated in terms of inflation, unemployment, inequality, sustainability and long-term productive capacity.
The broader set of goals is covered in macroeconomic objectives, while distributional issues are developed further in inequality and poverty.
Fiscal policy
Fiscal policy involves the use of government spending and taxation to influence aggregate demand and economic activity.
Expansionary fiscal policy means increasing government spending, reducing taxes, or both. This increases aggregate demand. On an AD/AS diagram, AD shifts right. In the short run, this may increase real output and reduce unemployment, especially when the economy has spare capacity. However, it may also increase inflationary pressure if the economy is close to full employment.
Contractionary fiscal policy means reducing government spending, increasing taxes, or both. This reduces aggregate demand. AD shifts left, which may reduce inflationary pressure but also lower real output and increase unemployment in the short run.
Fiscal policy can be targeted. For example, government spending on education, healthcare or infrastructure may support both short-run demand and long-run productive capacity. However, fiscal policy can face time lags, political constraints and budgetary limits.
You can explore this further in fiscal policy.
Monetary policy
Monetary policy is usually carried out by a central bank. It involves influencing interest rates, money supply and credit conditions to affect aggregate demand and inflation.
Expansionary monetary policy involves lower interest rates or easier credit conditions. Lower interest rates make borrowing cheaper and saving less attractive. This may increase consumption and investment, shifting aggregate demand right.
Contractionary monetary policy involves higher interest rates or tighter credit conditions. Higher interest rates make borrowing more expensive and saving more attractive. This may reduce consumption and investment, shifting aggregate demand left and reducing inflationary pressure.
Monetary policy is often used to control inflation, but it has limitations. Higher interest rates may reduce demand-pull inflation, but they may be less effective against cost-push inflation caused by higher oil prices or supply disruptions. They may also increase debt repayments for households and firms.
This is covered in monetary policy.
Supply-side policies
Supply-side policies aim to increase the productive capacity of the economy or improve the efficiency of markets. They are especially relevant for long-term growth, competitiveness and structural unemployment.
Market-based supply-side policies include reducing income taxes, reducing corporation taxes, deregulation, privatisation and labour market reforms. These policies aim to strengthen incentives and improve efficiency, but they may also increase inequality or reduce worker protection.
Interventionist supply-side policies include government spending on education, training, healthcare, infrastructure, research and development, and industrial policy. These can improve human capital, productivity and long-run aggregate supply, but they can be expensive and may take years to show results.
On an AD/AS diagram, successful supply-side policies shift LRAS to the right. This increases potential output and may reduce inflationary pressure in the long run.
For more detail, see supply-side policies.
IB exam relevance and common mistakes
Macroeconomics is highly important in IB exams because it combines definitions, diagrams, policy analysis and evaluation.
A strong answer defines the key term, applies the correct model, explains the chain of causation and evaluates the likely impact. For example, if discussing expansionary fiscal policy, a strong answer would explain how higher government spending increases aggregate demand, how this affects real output and unemployment, and why the effect depends on spare capacity, the multiplier, inflationary pressure and the state of public finances.
A common mistake is confusing GDP with living standards. Real GDP per capita is useful, but it does not fully measure well-being, inequality, environmental quality or unpaid work.
Another common mistake is treating inflation as any increase in one price. Inflation refers to a sustained rise in the general price level, not a temporary increase in the price of one good.
Students also often say that lower unemployment is always better without considering inflationary pressure, skills mismatch or the natural rate of unemployment. Similarly, they may claim that economic growth is always positive without evaluating sustainability or distributional effects.
Diagram errors are also common. In AD/AS diagrams, the vertical axis should show the average price level, and the horizontal axis should show real output. If aggregate demand changes, the AD curve shifts. If production costs change, SRAS shifts. If productive capacity changes, LRAS shifts.
Real-world evaluation: policy always involves trade-offs
Macroeconomic policy is rarely simple because economies face multiple objectives at the same time.
During a recession, expansionary fiscal or monetary policy may raise aggregate demand and reduce cyclical unemployment. However, if demand increases too much, inflation may rise. If the government borrows heavily, debt may become a concern. If interest rates stay low for too long, asset prices may rise unsustainably.
During periods of high inflation, contractionary monetary policy may reduce aggregate demand and help bring inflation down. However, higher interest rates can reduce investment, increase mortgage costs and raise unemployment.
Supply-side policies may improve long-term growth, but they often take time. Education reforms, infrastructure investment and research spending can increase productivity, but they do not usually solve an immediate recession quickly.
This is why IB evaluation should consider time periods, stakeholder impacts, the cause of the problem, the size of the output gap and whether the policy addresses demand-side or supply-side issues.
Conclusion
Macroeconomics in IB Economics is about understanding the whole economy. GDP measures output, inflation measures changes in the general price level, unemployment shows unused labour resources, and economic growth shows changes in real output and productive capacity.
The AD/AS model helps explain how these variables interact. Fiscal policy, monetary policy and supply-side policies show how governments and central banks try to influence the economy.
The strongest IB answers do not just describe policies. They explain cause and effect, use diagrams accurately and evaluate trade-offs between growth, inflation, unemployment, equity and sustainability.
Related syllabus topics
Measuring Economic Activity and Illustrating Its Variations
Unit 3.1: Measuring Economic Activity and Illustrating Its Variations
Variations in Economic Activity: Aggregate Demand and Aggregate Supply
Unit 3.2: Variations in Economic Activity: Aggregate Demand and Aggregate Supply
Macroeconomic Objectives
Unit 3.3: Macroeconomic Objectives
Economics of Inequality and Poverty
Unit 3.4: Economics of Inequality and Poverty
Demand Management (Monetary Policy)
Unit 3.5: Demand Management (Monetary Policy)
Demand Management (Fiscal Policy)
Unit 3.6: Demand Management (Fiscal Policy)
Supply-side Policies
Unit 3.7: Supply-side Policies
Related diagrams
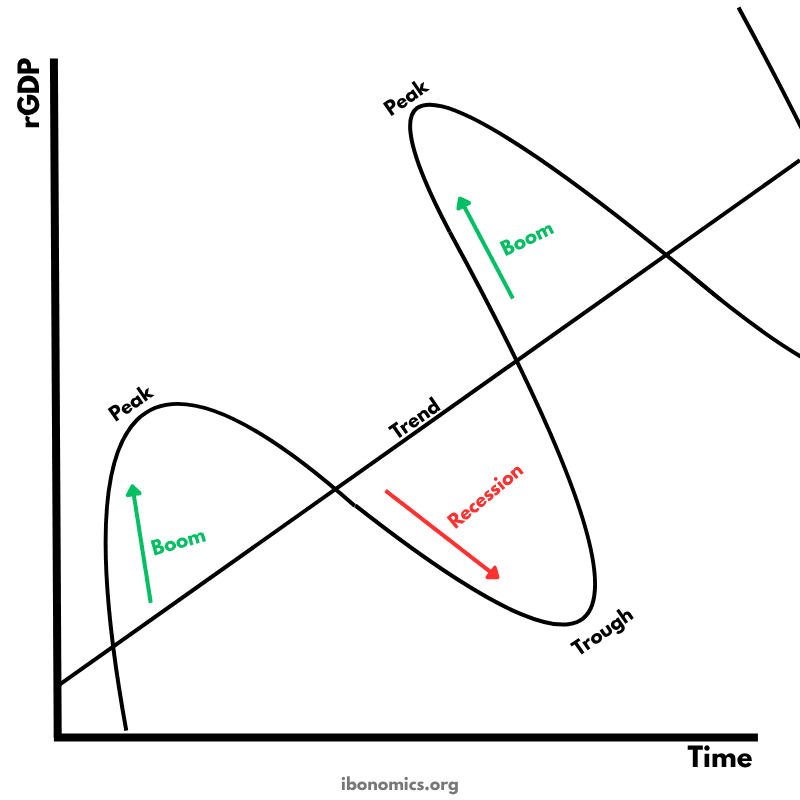
Business Cycle – Real GDP Over Time
AD–AS Diagram – Short-Run Macroeconomic Equilibrium
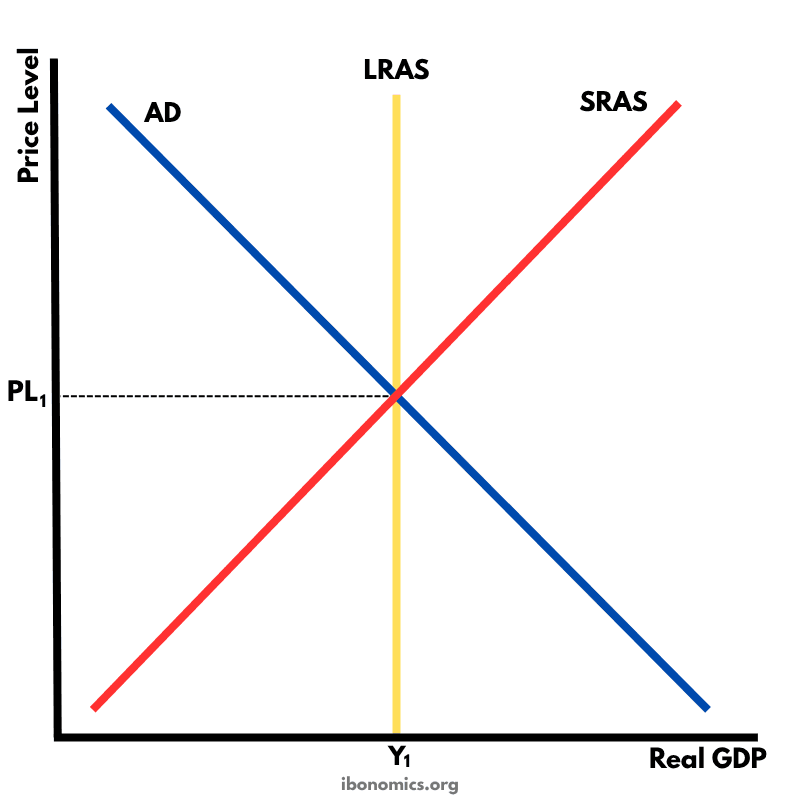
Classical AD–SRAS–LRAS Diagram – Long-Run Equilibrium
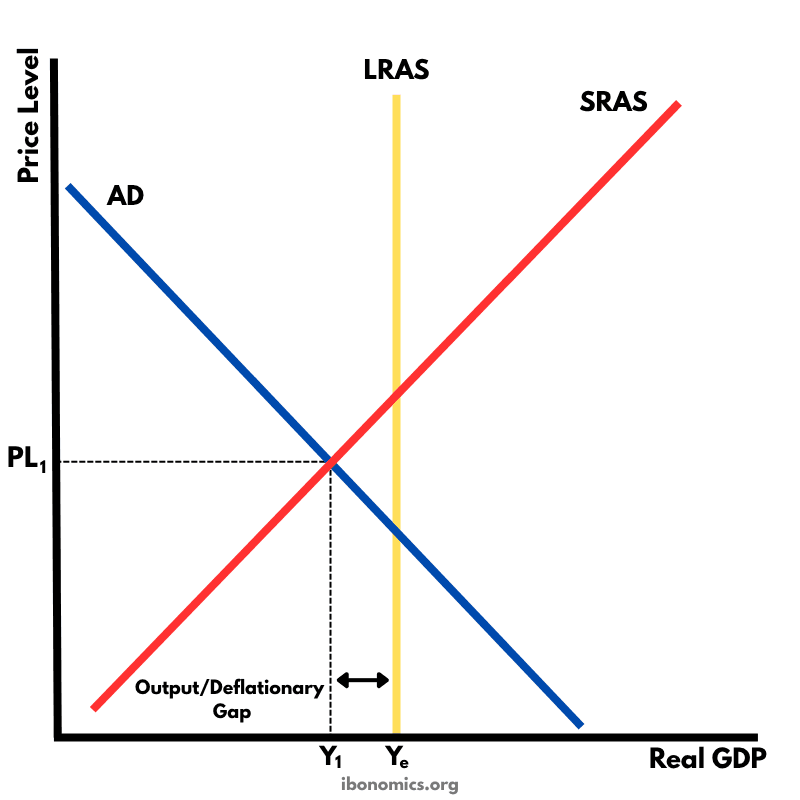
Output/Deflationary Gap – Below Full Employment Equilibrium
Cost-Push Inflation – SRAS Leftward Shift

Interest Rate Determination – Money Market Equilibrium
Expansionary Policy – Fiscal and Monetary Impact on AD
Contractionary Policy – Fiscal and Monetary Impact on AD
Long Run Economic Growth – Keynesian AS Model