Movements and Shifts of Demand and Supply Curves
Microeconomics
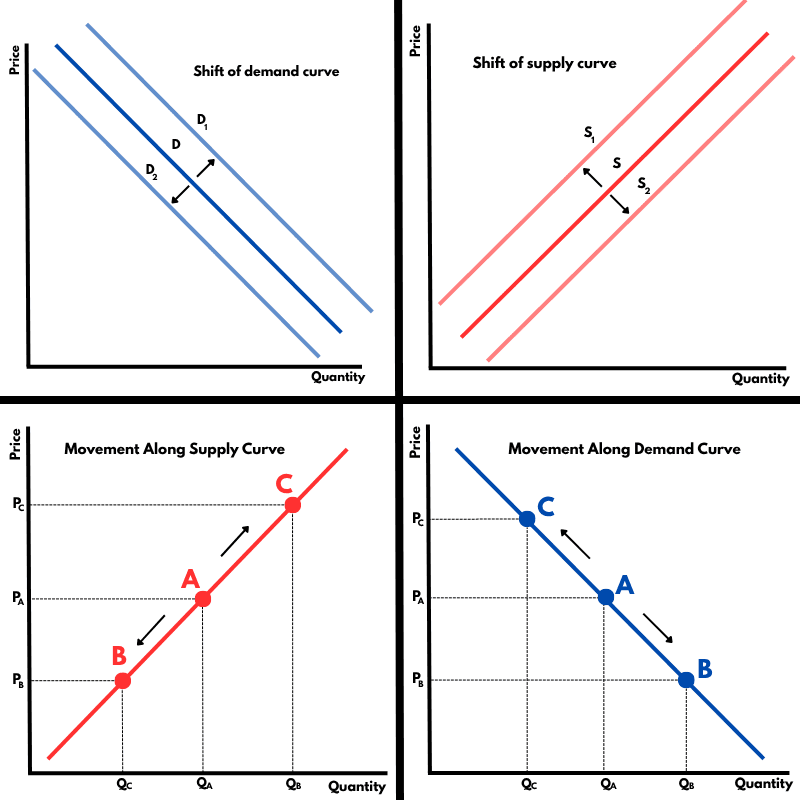
A compact diagram comparing movements along demand and supply curves with shifts of the demand and supply curves.
Curves and Elements
shift of demand
Shift of Demand Curve: The whole demand curve moves left or right because of a change in a non-price determinant such as income, tastes, or the price of related goods.
shift of supply
Shift of Supply Curve: The whole supply curve moves left or right because of a change in a non-price determinant such as costs of production, technology, taxes, or subsidies.
movement along demand
Movement Along Demand Curve: A change in the good’s own price causes movement from one point to another on the same demand curve.
movement along supply
Movement Along Supply Curve: A change in the good’s own price causes movement from one point to another on the same supply curve.
key difference
Key Difference: Price changes cause movements along curves, while non-price changes cause shifts of curves.
A movement along the demand curve is caused by a change in the good’s own price, leading to an extension or contraction in demand.
A movement along the supply curve is caused by a change in the good’s own price, leading to an extension or contraction in supply.
A shift of the demand curve occurs when a non-price determinant of demand changes, causing demand to increase or decrease at every price.
A shift of the supply curve occurs when a non-price determinant of supply changes, causing supply to increase or decrease at every price.
More Microeconomics Diagrams
Explore other diagrams from the same unit to deepen your understanding

The fundamental diagram showing the relationship between demand and supply in a competitive market, determining equilibrium price and quantity.

A basic diagram showing the inverse relationship between price and quantity demanded, illustrating the law of demand.

A basic diagram showing the positive relationship between price and quantity supplied, illustrating the law of supply.

A simple diagram showing four common forms of government intervention in markets: subsidies, taxes, price controls, and direct provision.

A diagram showing how price elasticity of demand changes along a straight-line demand curve, from elastic to unitary elastic to inelastic.

A diagram showing how price elasticity of demand affects total revenue, with total revenue maximized where demand is unitary elastic.