Long Run Average Cost and Minimum Efficient Scale
Microeconomics
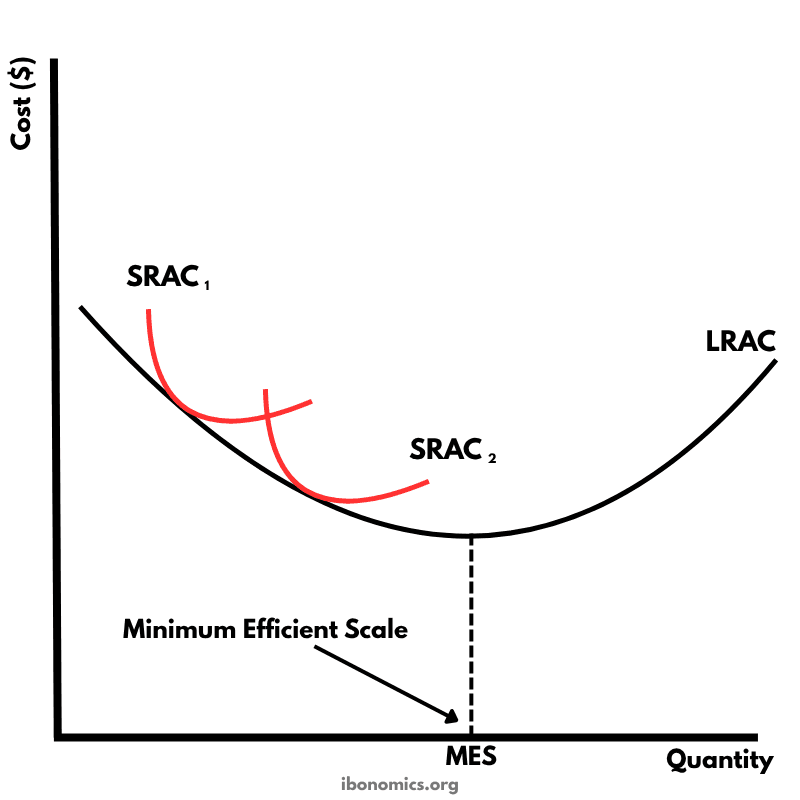
A diagram showing the long run average cost curve and the minimum efficient scale, where a firm reaches the lowest possible average cost in the long run.
Curves and Elements
srac 1
SRAC1: A short run average cost curve showing average cost for one possible plant size.
srac 2
SRAC2: Another short run average cost curve showing average cost for a different plant size.
lrac
LRAC: The long run average cost curve, showing the lowest achievable average cost for each output level when all inputs are variable.
mes
Minimum Efficient Scale (MES): The level of output where the LRAC curve reaches its minimum point.
economies of scale
Economies of Scale: The range over which LRAC falls as output increases.
diseconomies of scale
Diseconomies of Scale: The range over which LRAC rises as output increases beyond MES.
The long run average cost curve shows the lowest average cost of production possible at each level of output when all factors of production are variable.
The short run average cost curves show average costs for different plant sizes or scales of operation in the short run.
As output increases, the firm may experience economies of scale, causing long run average cost to fall.
Minimum efficient scale is the level of output at which the firm reaches the lowest point on the long run average cost curve.
Beyond the minimum efficient scale, diseconomies of scale may cause long run average cost to rise.
More Microeconomics Diagrams
Explore other diagrams from the same unit to deepen your understanding

The fundamental diagram showing the relationship between demand and supply in a competitive market, determining equilibrium price and quantity.

A basic diagram showing the inverse relationship between price and quantity demanded, illustrating the law of demand.

A basic diagram showing the positive relationship between price and quantity supplied, illustrating the law of supply.

A simple diagram showing four common forms of government intervention in markets: subsidies, taxes, price controls, and direct provision.

A diagram showing how price elasticity of demand changes along a straight-line demand curve, from elastic to unitary elastic to inelastic.

A diagram showing how price elasticity of demand affects total revenue, with total revenue maximized where demand is unitary elastic.