Abnormal Profit from Collusion in Oligopoly
Microeconomics
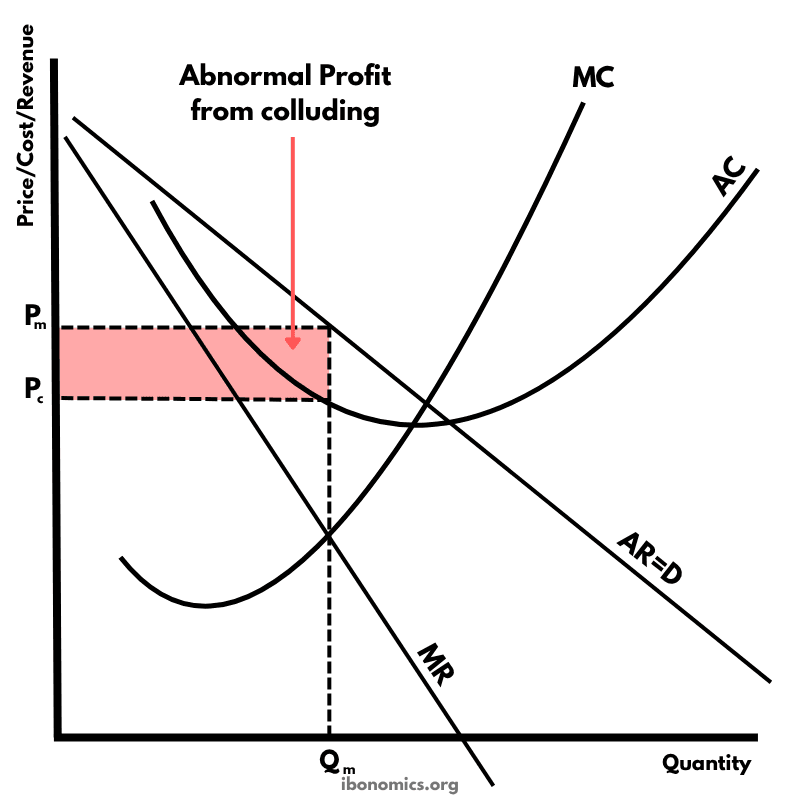
A diagram showing how firms in an oligopoly can earn abnormal profit when they collude and behave like a monopoly.
Curves and Elements
demand
AR = D: The average revenue curve, which is also the market demand curve.
marginal revenue
MR: The marginal revenue curve, which lies below the demand curve in imperfect competition.
marginal cost
MC: The marginal cost curve, showing the additional cost of producing one more unit.
average cost
AC: The average cost curve, showing cost per unit of output.
profit maximizing output
Profit-maximizing Output (Qm): The collusive level of output, found where MC equals MR.
collusive price
Collusive Price (Pm): The price charged at output Qm, found from the demand curve.
abnormal profit
Abnormal Profit: The shaded area between price and average cost at Qm, showing supernormal profit earned through collusion.
In collusion, firms cooperate rather than compete, often by agreeing on price or output.
When oligopolistic firms collude, they act like a monopoly and maximize joint profit by producing where marginal cost equals marginal revenue.
The collusive output is Qm, found where MC intersects MR, and the collusive price is Pm, found by projecting up to the demand curve.
Because average cost at Qm is lower than price, the firms earn abnormal profit.
The shaded area shows abnormal profit, equal to the difference between price and average cost multiplied by quantity sold.
More Microeconomics Diagrams
Explore other diagrams from the same unit to deepen your understanding

The fundamental diagram showing the relationship between demand and supply in a competitive market, determining equilibrium price and quantity.

A basic diagram showing the inverse relationship between price and quantity demanded, illustrating the law of demand.

A basic diagram showing the positive relationship between price and quantity supplied, illustrating the law of supply.

A simple diagram showing four common forms of government intervention in markets: subsidies, taxes, price controls, and direct provision.

A diagram showing how price elasticity of demand changes along a straight-line demand curve, from elastic to unitary elastic to inelastic.

A diagram showing how price elasticity of demand affects total revenue, with total revenue maximized where demand is unitary elastic.