Managed Exchange Rate – Permitted Band of Fluctuation
Global Economics
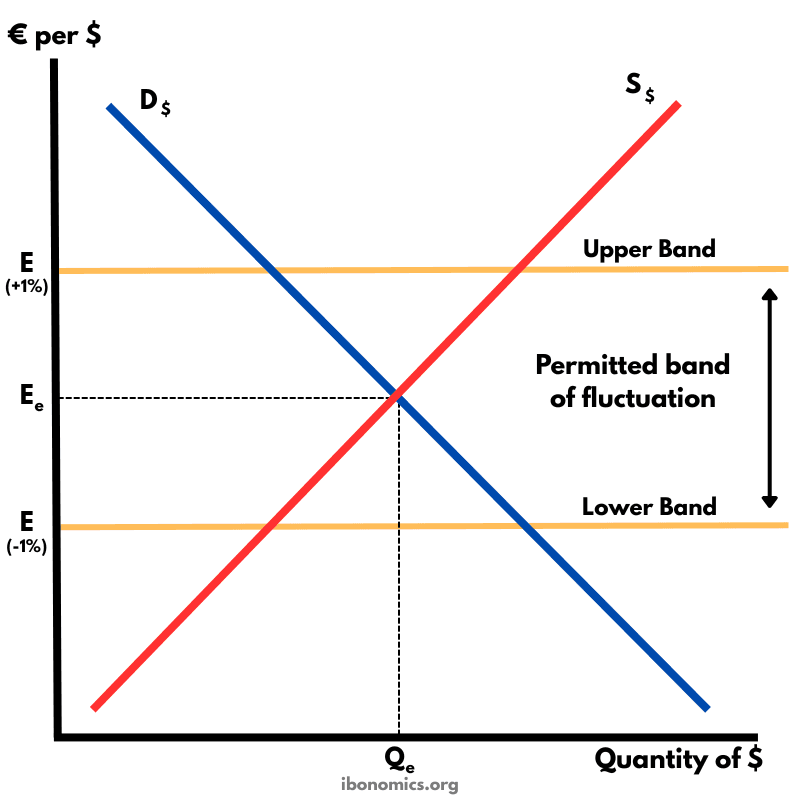
This diagram illustrates a managed exchange rate system where the currency is allowed to fluctuate only within an upper and lower band. The central bank intervenes whenever the exchange rate moves outside the permitted range to keep the value of the currency stable.
Curves and Elements
demand currency
Demand for the currency (D$): Downward-sloping because fewer euros are demanded per dollar at higher prices.
supply currency
Supply of the currency (S$): Upward-sloping because more dollars are supplied when the exchange rate rises.
equilibrium rate
Ee: The natural equilibrium exchange rate without intervention.
upper band
Upper Band (+1%): Maximum allowed exchange rate before central bank intervention.
lower band
Lower Band (−1%): Minimum allowed exchange rate before central bank intervention.
The equilibrium exchange rate is shown at Ee, where supply and demand for the currency intersect.
The central bank sets an upper and lower band (for example, ±1%) around the target rate.
If the exchange rate rises toward the upper band, the currency becomes too strong, so the central bank sells its own currency to increase supply and push the value down.
If the exchange rate falls toward the lower band, the currency becomes too weak, so the central bank buys its own currency to reduce supply and push the value up.
The purpose of these interventions is to reduce excessive volatility while still allowing limited movement in the exchange rate.
More Global Economics Diagrams
Explore other diagrams from the same unit to deepen your understanding
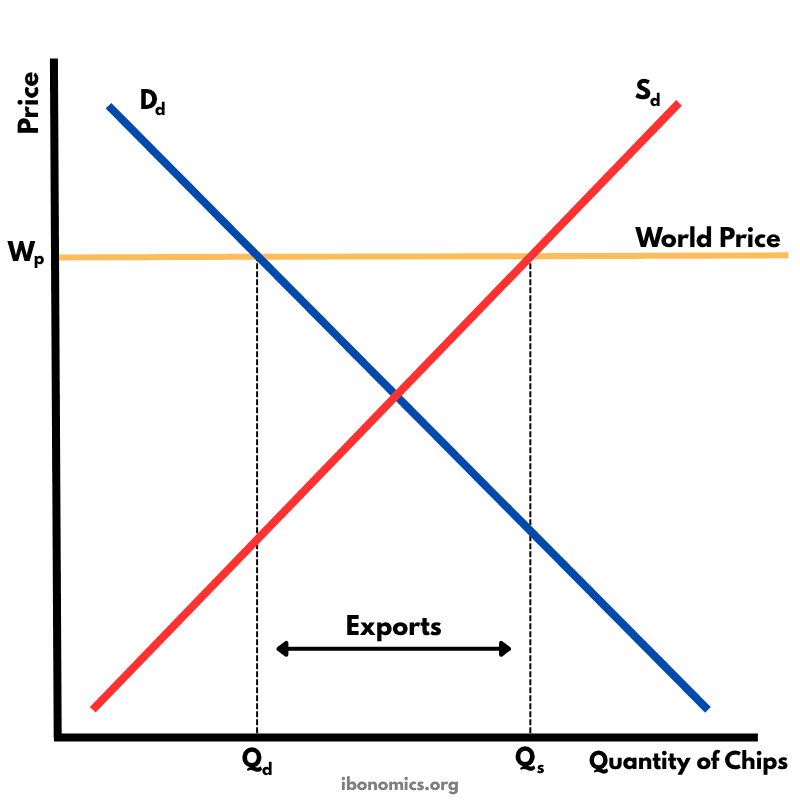
This diagram shows how a country exports goods under free trade when the world price is higher than the domestic equilibrium price.
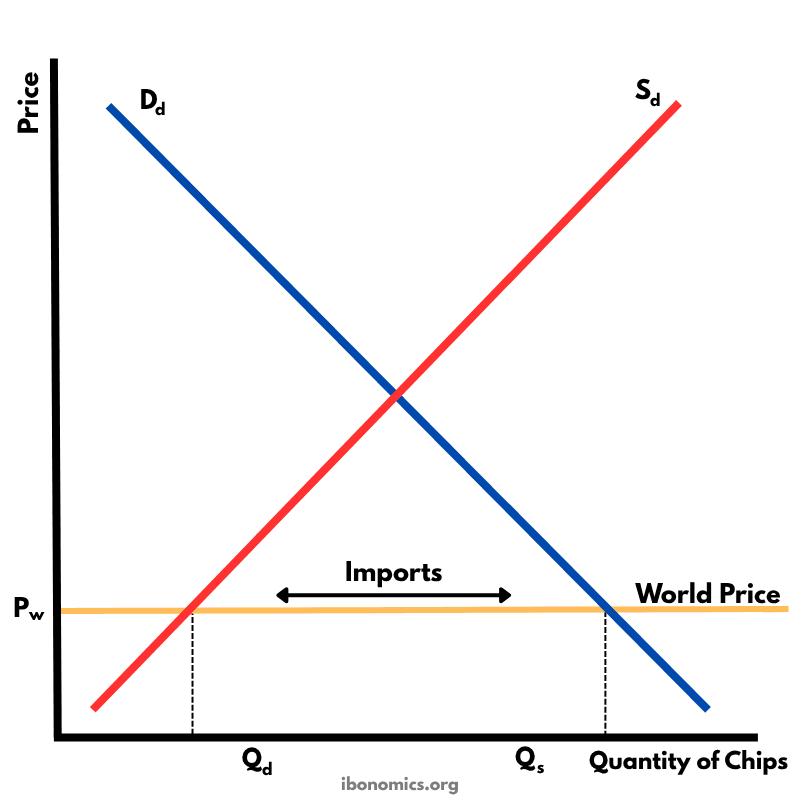
This diagram illustrates how a country imports goods under free trade when the world price is lower than the domestic equilibrium price.
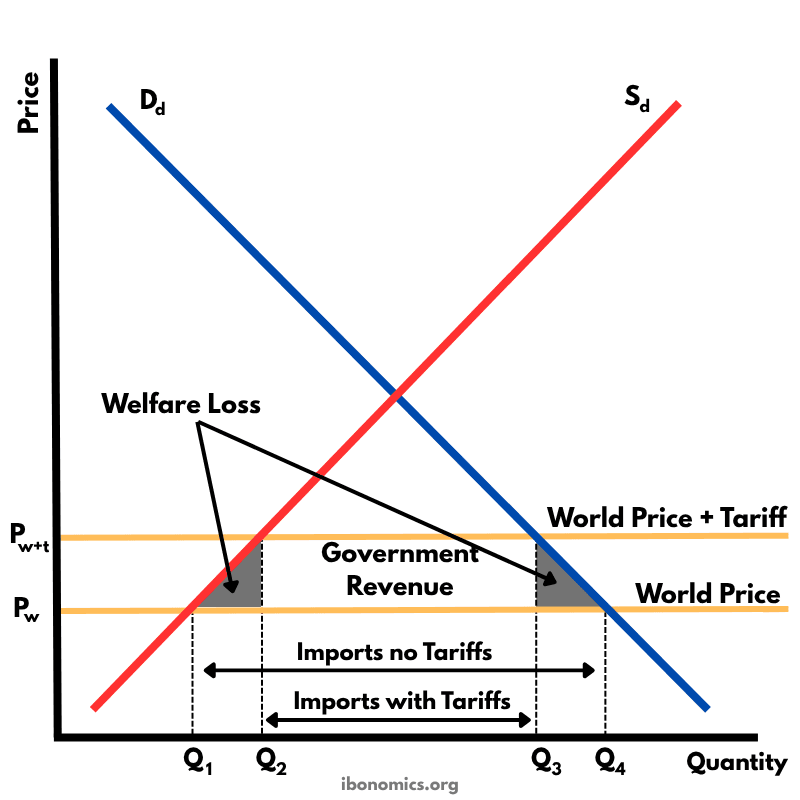
This diagram shows the effects of a tariff imposed on imported goods. A tariff raises the price of imports, protecting domestic producers but creating welfare losses.
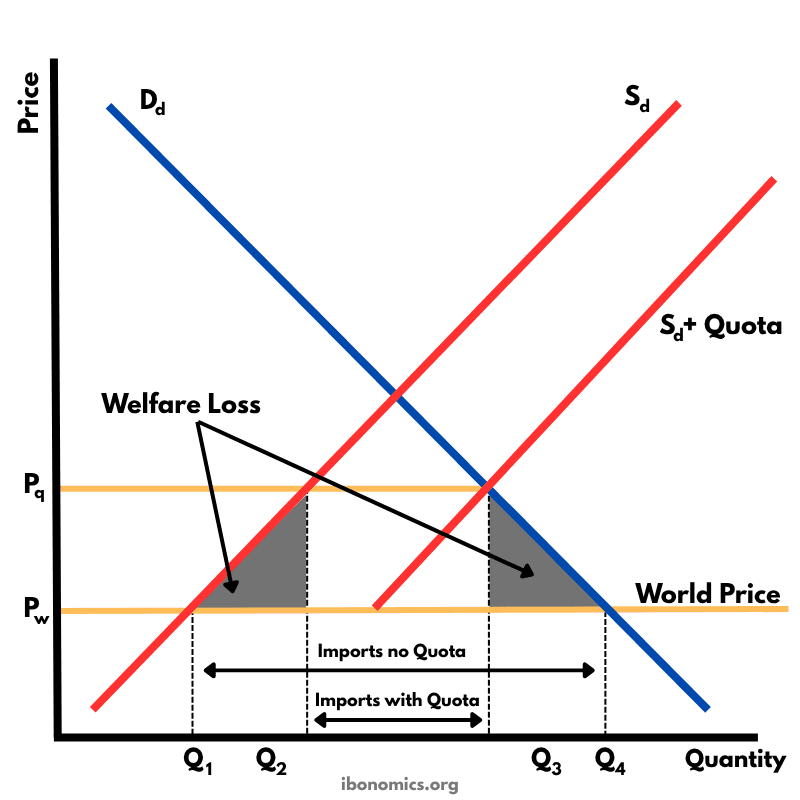
This diagram shows the impact of an import quota that limits how many units of a good can be imported. By restricting imports, the domestic price rises above the world price, domestic producers expand output, consumers buy less, and there is a net welfare loss.
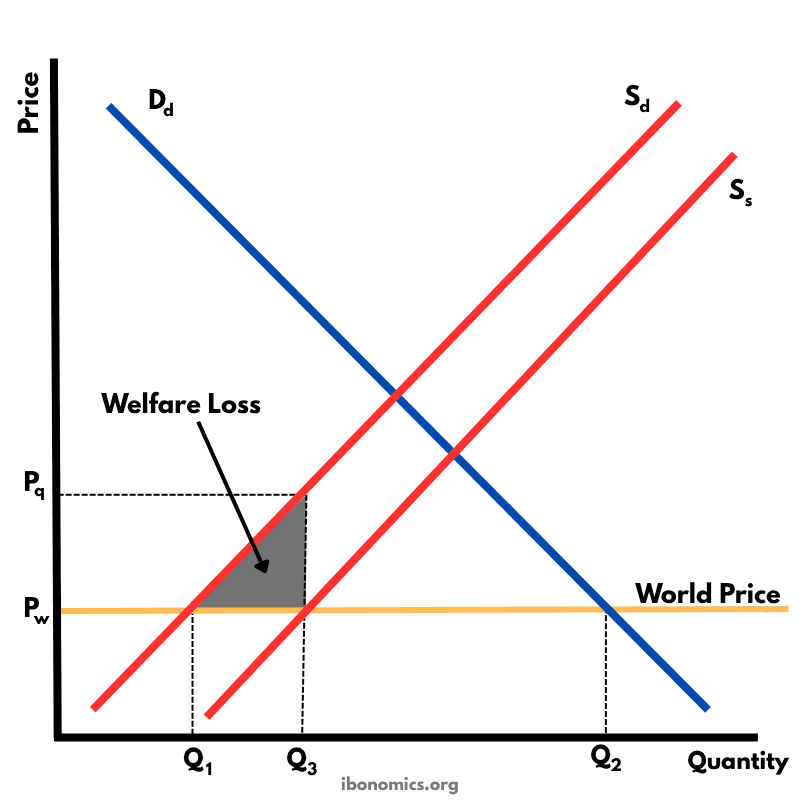
This diagram illustrates the effects of a production subsidy, where the government supports domestic producers to lower their costs and increase output. It is a form of protectionism without raising consumer prices directly.
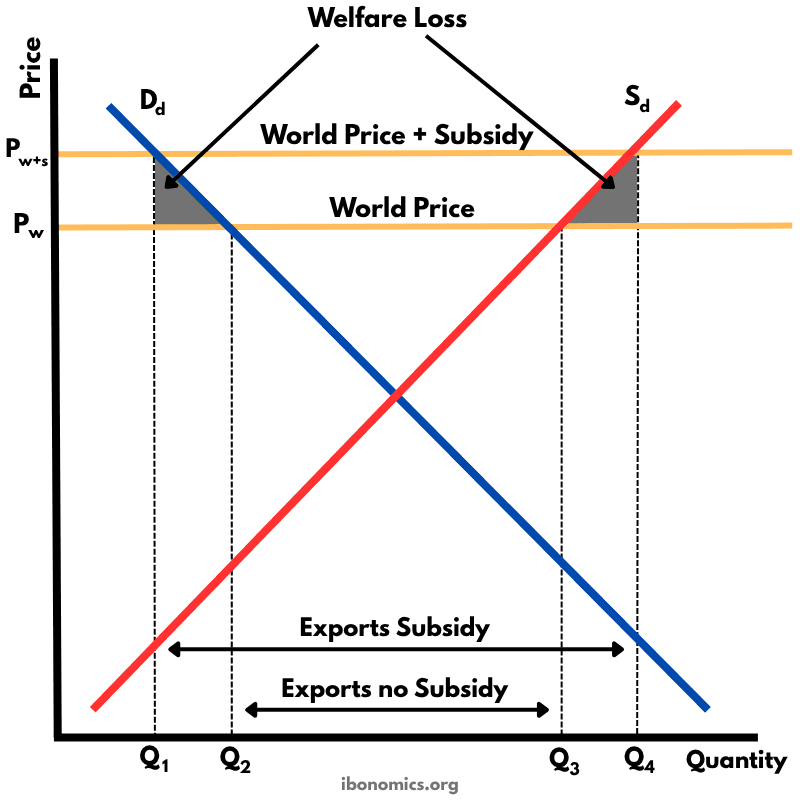
This diagram shows how an export subsidy raises the domestic price above the world price, encouraging producers to export more while reducing consumer welfare and creating deadweight losses.