Free Trade – Exporting Country
Global Economics
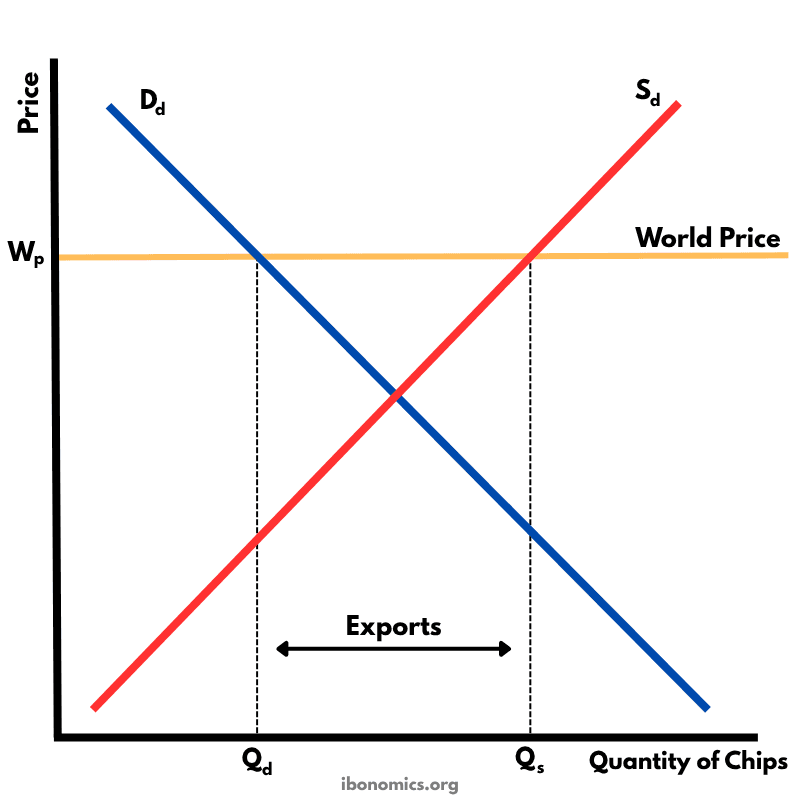
This diagram shows how a country exports goods under free trade when the world price is higher than the domestic equilibrium price.
Curves and Elements
dd
Dd: Domestic demand for the good (e.g., chips).
sd
Sd: Domestic supply of the good.
wp
Wp: World price, higher than the domestic equilibrium price.
qd
Qd: Quantity demanded at the world price.
qs
Qs: Quantity supplied at the world price.
exports
Exports: The surplus of production (Qs − Qd) that is sold to foreign buyers.
In the absence of trade, the domestic equilibrium occurs where domestic supply (Sd) intersects domestic demand (Dd).
When the world price (Wp) is above the domestic equilibrium price, domestic producers are willing to supply more (Qs), while domestic consumers demand less (Qd).
The surplus of goods, represented by the difference between Qs and Qd, is exported to the rest of the world.
This benefits domestic producers who receive higher prices and increase production, but may harm domestic consumers who face higher prices and buy less.
Overall, the country specializes in the good it has a comparative advantage in, increasing global efficiency and welfare under free trade.
More Global Economics Diagrams
Explore other diagrams from the same unit to deepen your understanding
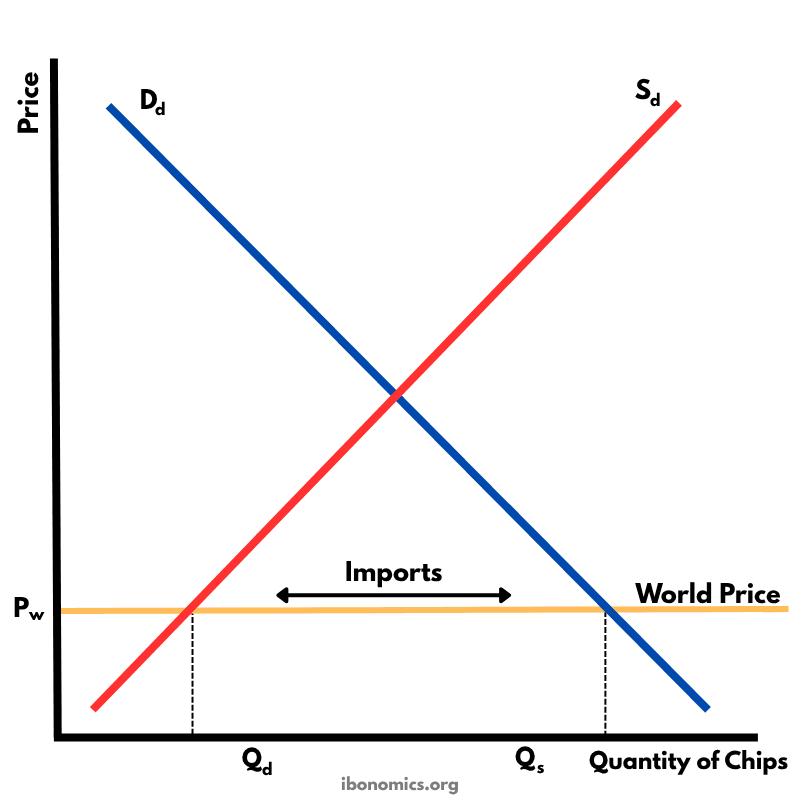
This diagram illustrates how a country imports goods under free trade when the world price is lower than the domestic equilibrium price.
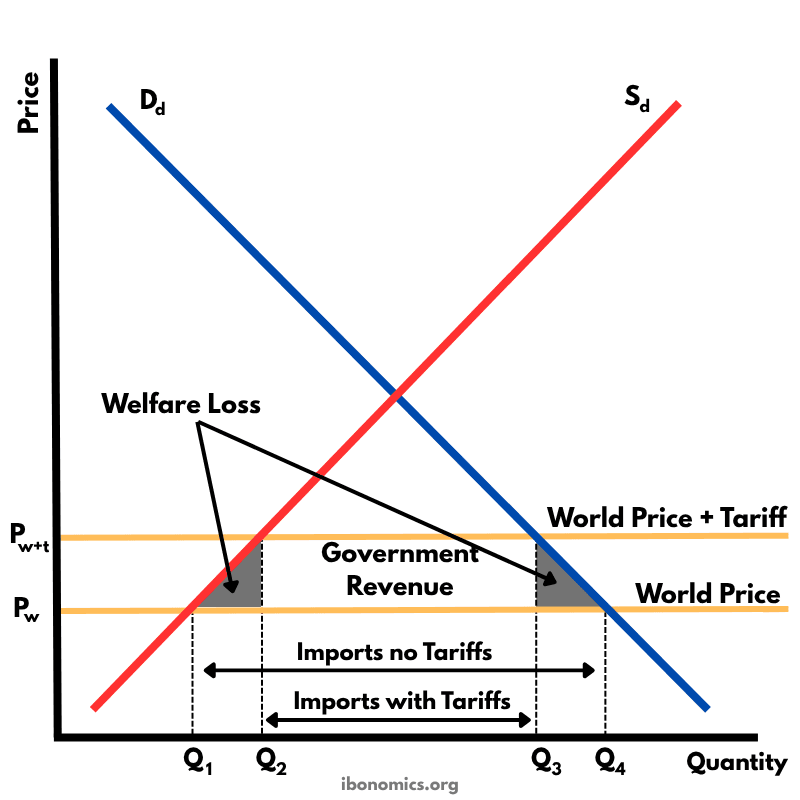
This diagram shows the effects of a tariff imposed on imported goods. A tariff raises the price of imports, protecting domestic producers but creating welfare losses.
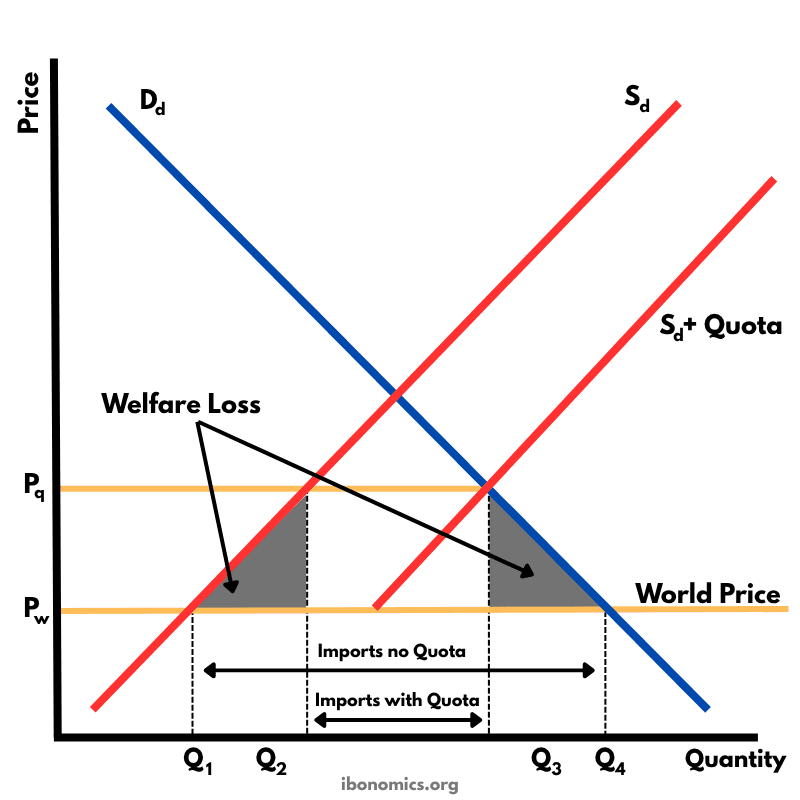
This diagram shows the impact of an import quota that limits how many units of a good can be imported. By restricting imports, the domestic price rises above the world price, domestic producers expand output, consumers buy less, and there is a net welfare loss.
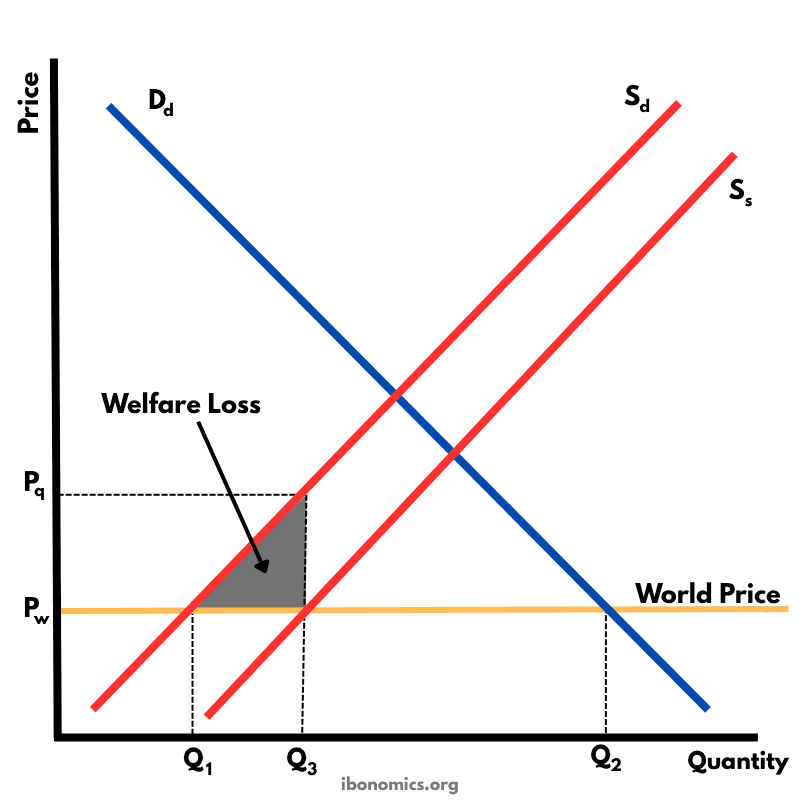
This diagram illustrates the effects of a production subsidy, where the government supports domestic producers to lower their costs and increase output. It is a form of protectionism without raising consumer prices directly.
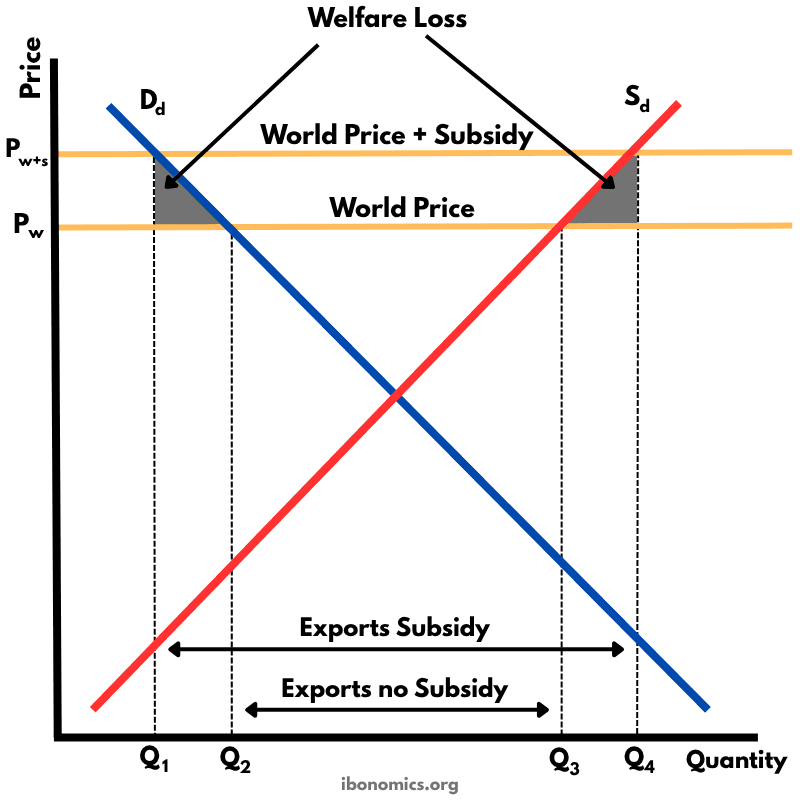
This diagram shows how an export subsidy raises the domestic price above the world price, encouraging producers to export more while reducing consumer welfare and creating deadweight losses.
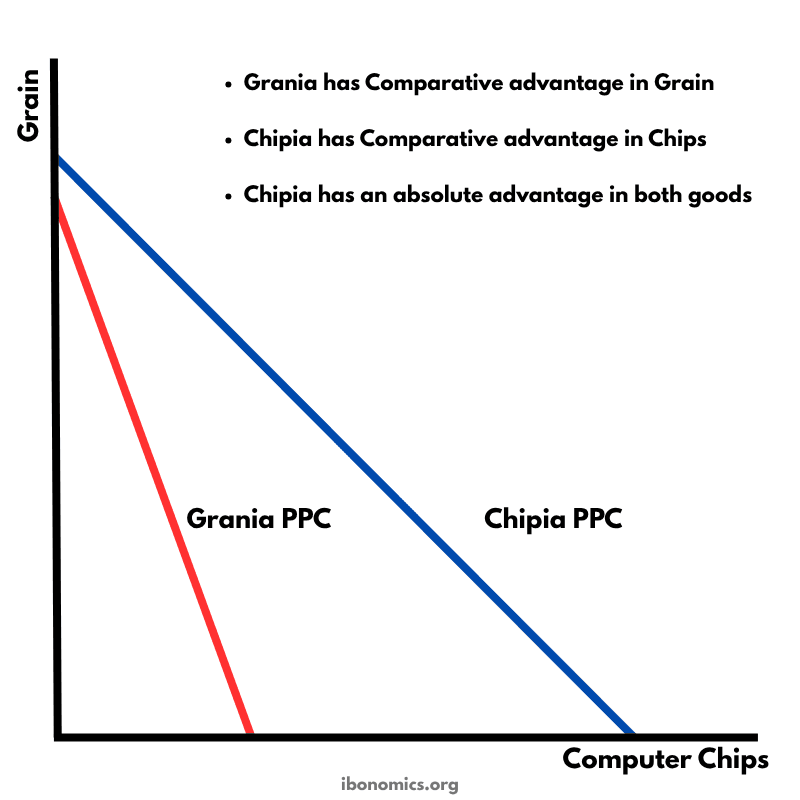
This diagram uses production possibility curves (PPCs) for two countries—Grania and Chipia—to illustrate absolute and comparative advantage and the potential gains from trade.