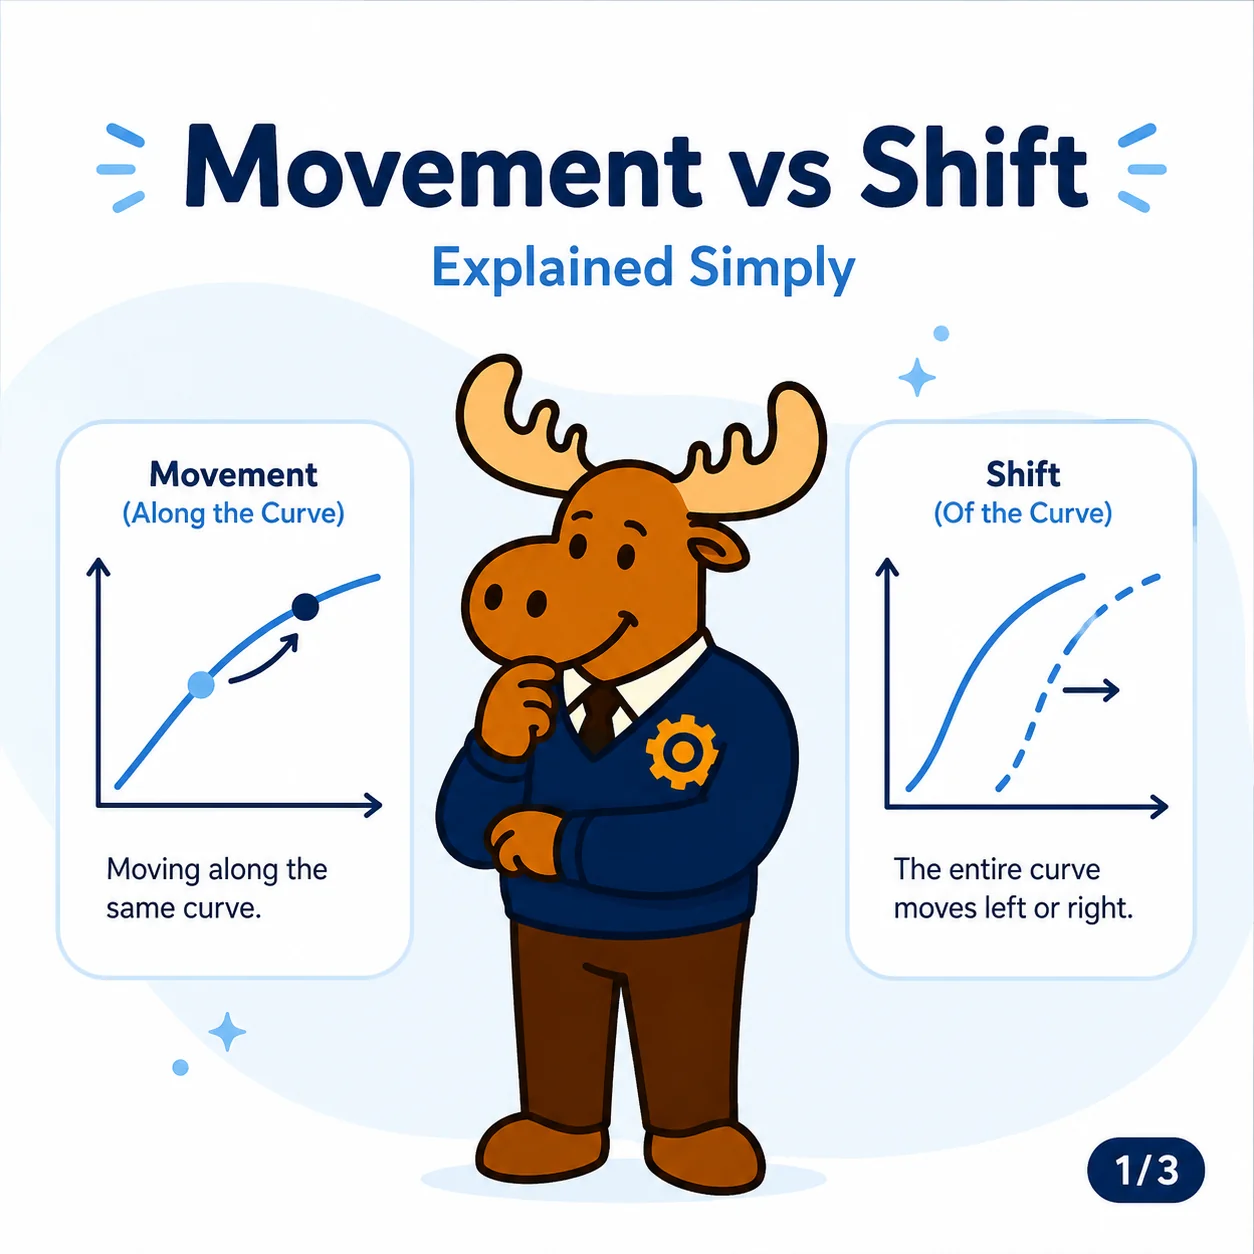
Movement Along a Curve vs Shift of a Curve: The Most Important Diagram Distinction in IB Economics
A clear IB Economics explanation of the difference between movements along curves and shifts of curves in demand and supply diagrams.

Movement Along a Curve vs Shift of a Curve: The Most Important Diagram Distinction in IB Economics
One of the most important diagram skills in IB Economics is knowing the difference between a movement along a curve and a shift of a curve. This distinction appears in demand and supply, elasticity, market equilibrium, taxes, subsidies, externalities and many other topics.
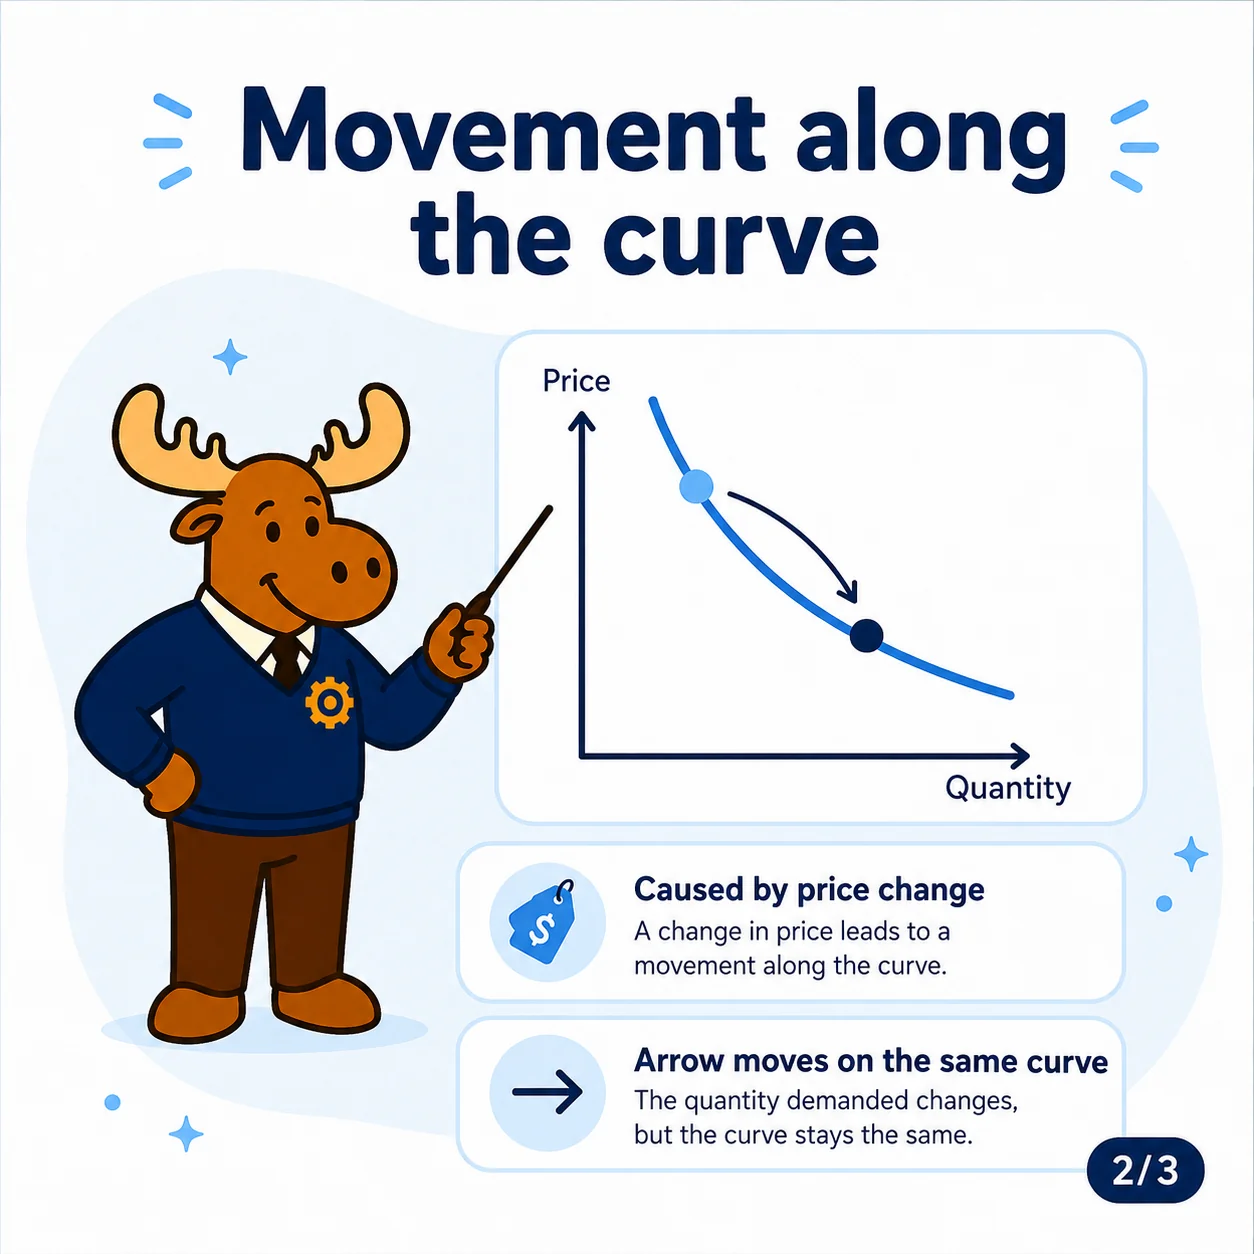
The basic rule is simple: a change in the price of the good itself causes a movement along the curve. A change in a non-price factor causes the whole curve to shift.
This sounds small, but it changes the entire analysis. If you shift a curve when you should have shown a movement along it, your explanation of price, quantity, incentives and equilibrium will be incorrect. Strong IB answers need to identify the cause of the change first, then choose the correct diagram response.
The core intuition
A curve shows a relationship between two variables while other factors are held constant. In a demand diagram, the demand curve shows the relationship between price and quantity demanded, ceteris paribus. In a supply diagram, the supply curve shows the relationship between price and quantity supplied, ceteris paribus.
Ceteris paribus means all other relevant factors are held constant. This assumption matters because it lets economists isolate one relationship at a time.
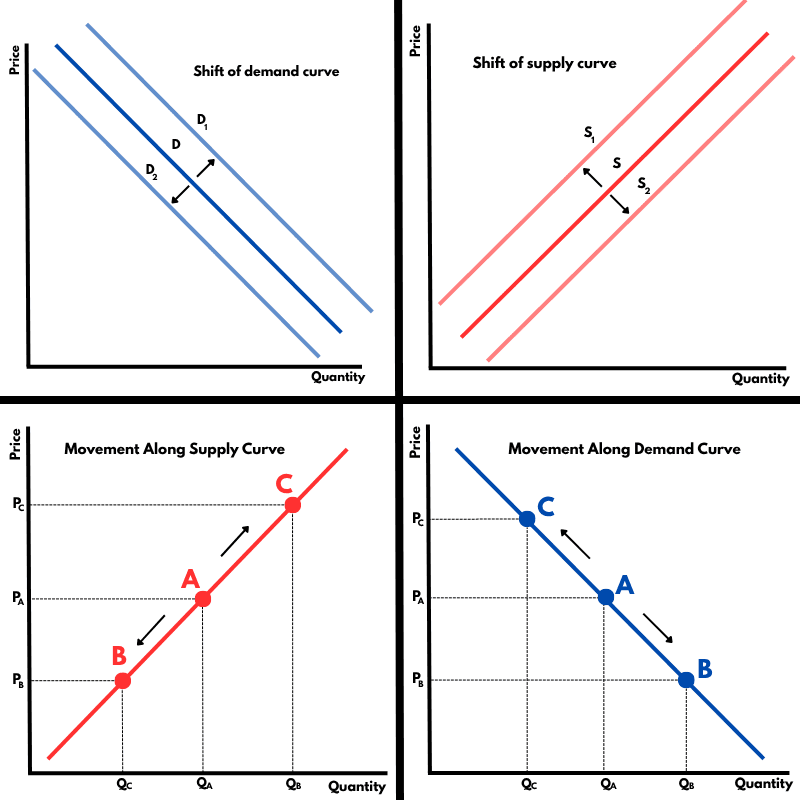
A movement along a curve happens when the variable on one of the diagram axes changes. In a standard demand or supply diagram, price is on the vertical axis and quantity is on the horizontal axis. Therefore, a change in the good’s own price creates a movement along the existing curve.
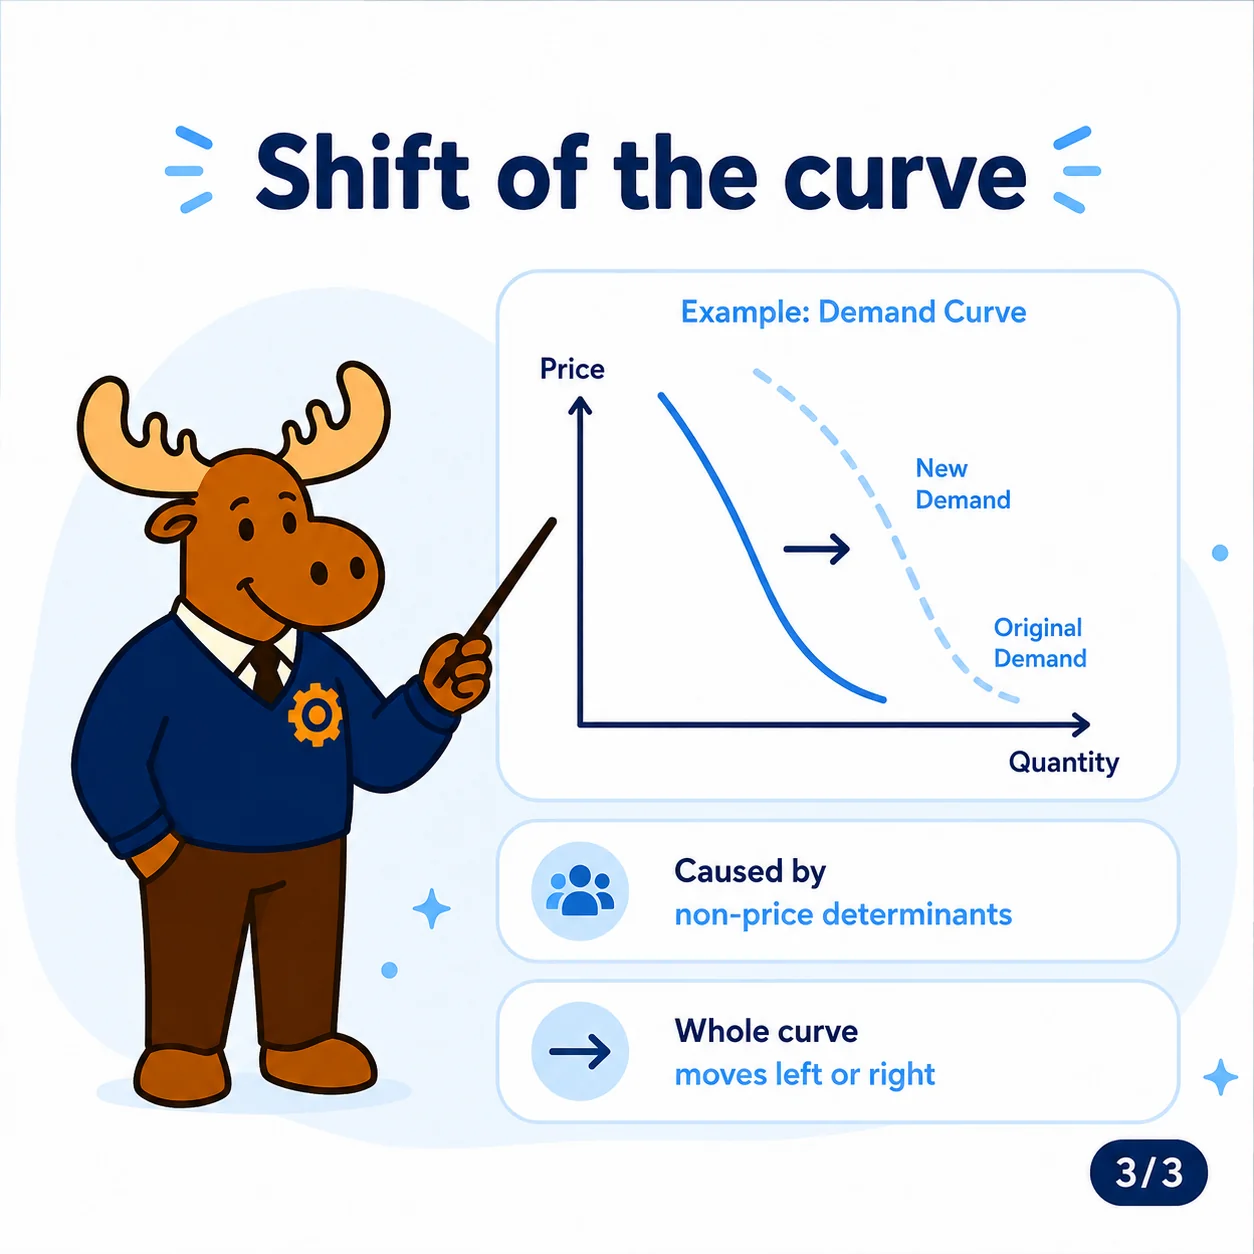
A shift of a curve happens when something outside the axes changes. For demand, this could be income, tastes, advertising or the price of a substitute. For supply, this could be production costs, technology, subsidies or the number of firms.
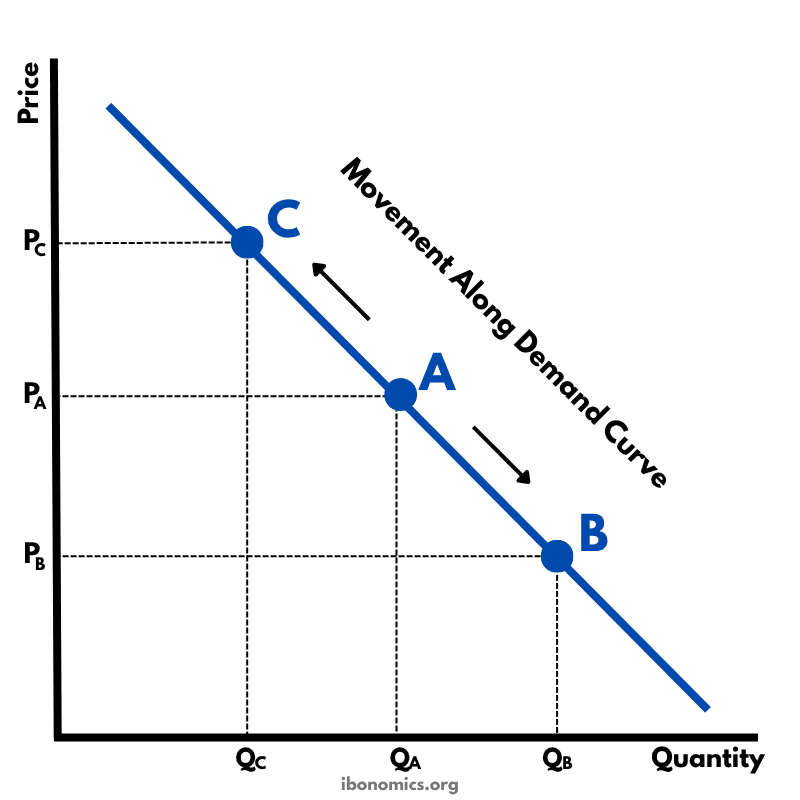
Movement along a demand curve
A movement along the demand curve happens when the price of the good itself changes.
The demand curve has price on the vertical axis and quantity demanded on the horizontal axis. It usually slopes downward because of the law of demand: as price falls, quantity demanded rises, ceteris paribus.
If the price of a good falls, there is an extension of demand. This is a movement down along the demand curve to a higher quantity demanded. Consumers are willing and able to buy more because the good is cheaper.
If the price of a good rises, there is a contraction of demand. This is a movement up along the demand curve to a lower quantity demanded. Consumers buy less because the good is now more expensive.
The demand curve itself does not shift because the cause of the change is already represented on the vertical axis: price.
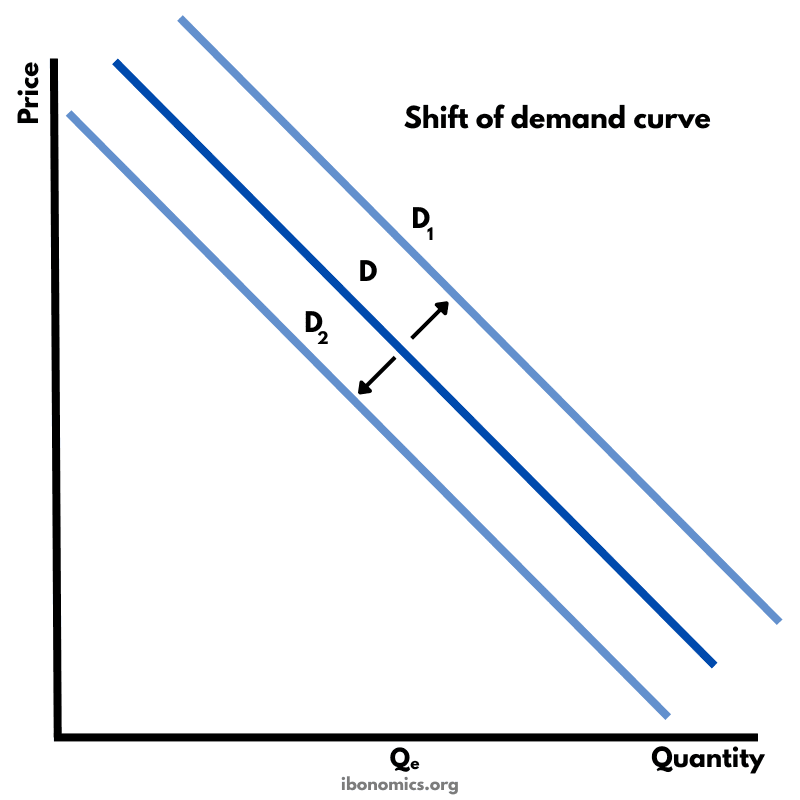
Shift of a demand curve
A shift of the demand curve happens when a non-price determinant of demand changes. This means consumers are willing and able to buy more or less at every price.
The vertical axis still shows price, and the horizontal axis still shows quantity. But the whole demand curve moves because something other than the good’s own price has changed.
Demand shifts right when demand increases. At each price, consumers want to buy more. This may happen because consumer income rises for a normal good, tastes become more favourable, the price of a substitute rises, the price of a complement falls, advertising becomes more effective, or the number of consumers increases.
Demand shifts left when demand decreases. At each price, consumers want to buy less. This may happen because income falls for a normal good, tastes become less favourable, the price of a substitute falls, the price of a complement rises, or consumers expect lower prices in the future.
For example, if the price of coffee falls, there is a movement along the coffee demand curve. But if consumer income rises and coffee is a normal good, the demand curve for coffee shifts right.
This is explained further in movements versus shifts of the demand curve and non-price determinants of demand.
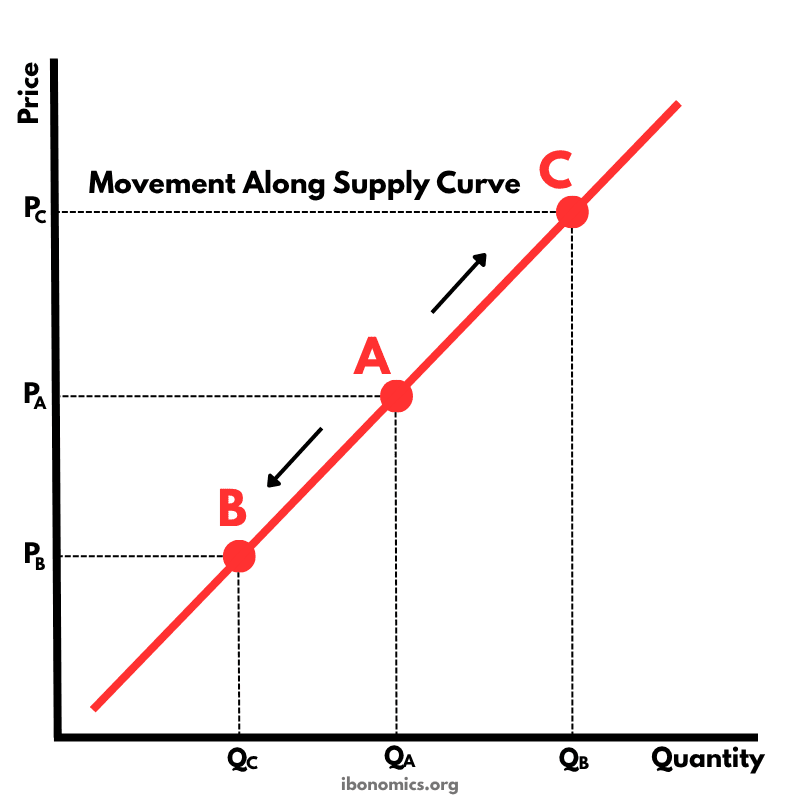
Movement along a supply curve
A movement along the supply curve happens when the price of the good itself changes.
The supply curve has price on the vertical axis and quantity supplied on the horizontal axis. It usually slopes upward because of the law of supply: as price rises, quantity supplied rises, ceteris paribus.
If the price of a good rises, there is an extension of supply. This is a movement up along the supply curve to a higher quantity supplied. Producers have a stronger incentive to produce because selling the good is now more profitable.
If the price of a good falls, there is a contraction of supply. This is a movement down along the supply curve to a lower quantity supplied. Producers supply less because the good has become less profitable.
Again, the supply curve itself does not shift. The cause is the good’s own price, and price is already shown on the vertical axis.
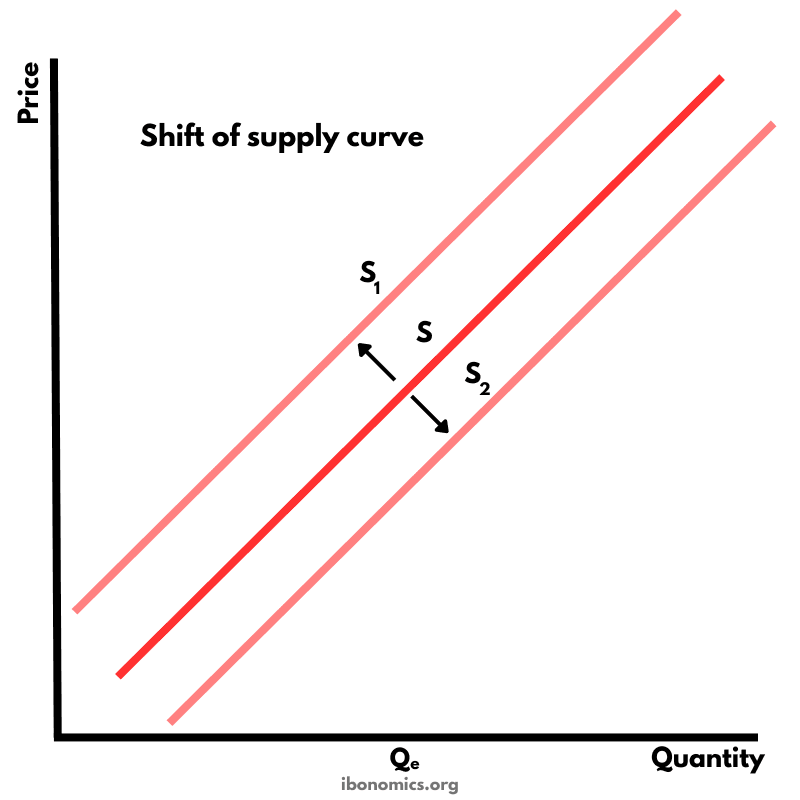
Shift of a supply curve
A shift of the supply curve happens when a non-price determinant of supply changes. This means producers are willing and able to supply more or less at every price.
Supply shifts right when supply increases. At each price, producers are willing and able to sell more. This may happen because production costs fall, technology improves, indirect taxes are reduced, subsidies increase, the number of firms rises, or weather conditions improve for agricultural products.
Supply shifts left when supply decreases. At each price, producers are willing and able to sell less. This may happen because production costs rise, technology becomes less effective, indirect taxes increase, subsidies are removed, firms leave the market, or weather conditions damage production.
For example, if the price of wheat rises, there is a movement along the wheat supply curve. But if fertiliser costs rise, the supply curve for wheat shifts left because wheat becomes more expensive to produce at every price.
You can review this in movements versus shifts of the supply curve and non-price determinants of supply.
How this affects market equilibrium
The distinction becomes especially important when analysing market equilibrium. Equilibrium occurs where demand equals supply. On a diagram, this is where the demand curve and supply curve intersect.
If demand shifts right while supply stays fixed, equilibrium price rises and equilibrium quantity rises. This is because consumers want more at every price, creating excess demand at the original equilibrium price. Price is bid up, and producers respond with an extension of supply.
Notice the chain of causation. The original change is a shift of demand. The resulting higher price then causes a movement along the supply curve.
If supply shifts right while demand stays fixed, equilibrium price falls and equilibrium quantity rises. This is because producers are willing and able to supply more at every price, creating excess supply at the original equilibrium price. Price falls, and consumers respond with an extension of demand.
Again, the original change is a shift of supply. The resulting lower price causes a movement along the demand curve.
This is why many equilibrium diagrams contain both a shift and a movement along the other curve. The key is identifying which curve shifts first and why.
For practice with this, see shifting demand and supply curves.
Example: higher income and restaurant meals
Suppose consumer incomes rise and restaurant meals are a normal good. The cause of the change is income, not the price of restaurant meals.
Income is a non-price determinant of demand, so the demand curve for restaurant meals shifts right. At the original price, quantity demanded is now greater than quantity supplied. This creates excess demand.
As a result, the market price rises. The higher price gives restaurants an incentive to supply more meals, so there is a movement up along the supply curve. The new equilibrium has a higher price and a higher quantity.
A common mistake would be to say that higher income causes a movement along the demand curve. It does not. Income is not shown on either axis, so it shifts demand.
Example: higher production costs and bicycles
Suppose the cost of aluminium rises and aluminium is used to produce bicycles. The cause of the change is production cost, not the price of bicycles.
Production cost is a non-price determinant of supply, so the supply curve for bicycles shifts left. At the original price, quantity supplied is now lower than quantity demanded. This creates excess demand.
As a result, the market price rises. The higher price causes consumers to buy fewer bicycles, so there is a movement up along the demand curve. The new equilibrium has a higher price and a lower quantity.
A common mistake would be to say that higher production costs cause a movement along the supply curve. They do not. Production costs are not shown on the axes, so they shift supply.
IB exam relevance and common mistakes
This distinction is highly exam-relevant because many IB questions ask students to analyse a change in a market. The first step should always be to identify whether the cause is price or a non-price determinant.
A strong answer should follow a clear chain:
- Identify the original cause of the change.
- Decide whether it causes a movement or a shift.
- State which curve moves or shifts.
- Explain the effect on equilibrium price and quantity.
- Evaluate where appropriate.
A common mistake is writing “demand increases because price falls.” This is not precise. If price falls, quantity demanded increases. Demand itself does not increase. Demand increases only when the whole demand curve shifts right.
Another common mistake is writing “supply decreases because price falls.” Again, this is not precise. If price falls, quantity supplied decreases. Supply itself does not decrease unless the whole supply curve shifts left.
Students also sometimes shift both demand and supply without explaining why. Do not shift a curve unless there is a clear determinant causing it. For example, higher demand for electric cars shifts demand right. It does not automatically shift supply right unless there is also a reason producers are more willing and able to supply electric cars at every price.
Why the wording matters
IB Economics is very precise with wording. “Demand” and “quantity demanded” are not the same thing. “Supply” and “quantity supplied” are not the same thing.
Demand refers to the whole relationship between price and quantity demanded. Quantity demanded refers to one specific amount consumers are willing and able to buy at a particular price.
Supply refers to the whole relationship between price and quantity supplied. Quantity supplied refers to one specific amount producers are willing and able to sell at a particular price.
This matters because saying “demand rises” means the whole curve shifts right. Saying “quantity demanded rises” means there is a movement along the existing demand curve.
Using the right wording makes your diagram explanation clearer and more accurate.
Evaluation: diagrams simplify real markets
Demand and supply diagrams are useful because they isolate cause and effect. They help show how one change affects equilibrium price and quantity while holding other factors constant.
However, real markets often experience several changes at once. For example, the market for electric cars may be affected by higher fuel prices, government subsidies, improved battery technology, changing consumer preferences and more charging infrastructure at the same time.
Some of these factors shift demand. Others shift supply. If both curves shift, the final effect on price or quantity may be uncertain without knowing the relative size of each shift.
This is where evaluation becomes important. A diagram helps explain the direction of change under specific assumptions, but real-world outcomes depend on the scale of each change, time periods, elasticities and market conditions.
Conclusion
The difference between a movement along a curve and a shift of a curve is one of the most important diagram distinctions in IB Economics.
A change in the good’s own price causes a movement along the curve. A change in a non-price determinant causes the whole curve to shift.
For demand, price changes affect quantity demanded, while income, tastes, substitutes, complements and population can shift demand. For supply, price changes affect quantity supplied, while production costs, technology, taxes, subsidies and the number of firms can shift supply.
Once you master this distinction, demand and supply diagrams become much easier to use accurately in IB Economics essays, data-response questions and evaluation.
Related syllabus topics
Demand Curve
Unit 2.1: Demand
Non-price Determinants of Demand
Unit 2.1: Demand
Movements vs Shifts of Demand Curve
Unit 2.1: Demand
Supply Curve
Unit 2.2: Supply
Non-price Determinants of Supply
Unit 2.2: Supply
Movements vs Shifts of Supply Curve
Unit 2.2: Supply
Shifting Demand and Supply Curves
Unit 2.3: Competitive Market Equilibrium